This article describes how to set up LogDNA for OpenShift on the IBM Cloud.
There are multiple ways to do logging with OpenShift. In my article OpenShift Logging Quick Start I described how to set up logging components in OpenShift clusters.
Alternatively there are also several managed services. Especially for logging I like using external services since running logging within your own clusters can be quite resource intensive.
IBM Log Analysis
IBM provides IBM Log Analysis which is a managed service which uses a third party service, called LogDNA.
The documentation summarizes why you should consider using this service rather than the built-in logging tools.
- Customizable user interface for live streaming of log tailing, real-time troubleshooting issue alerts, and log archiving.
- Quick integration with the cluster via a script.
- Aggregated logs across clusters and cloud providers.
- Historical access to logs that is based on the plan you choose.
- Highly available, scalable, and compliant with industry security standards.
- Integrated with IBM Cloud IAM for user access management.
- Flexible plans, including a free Lite option.
Setup
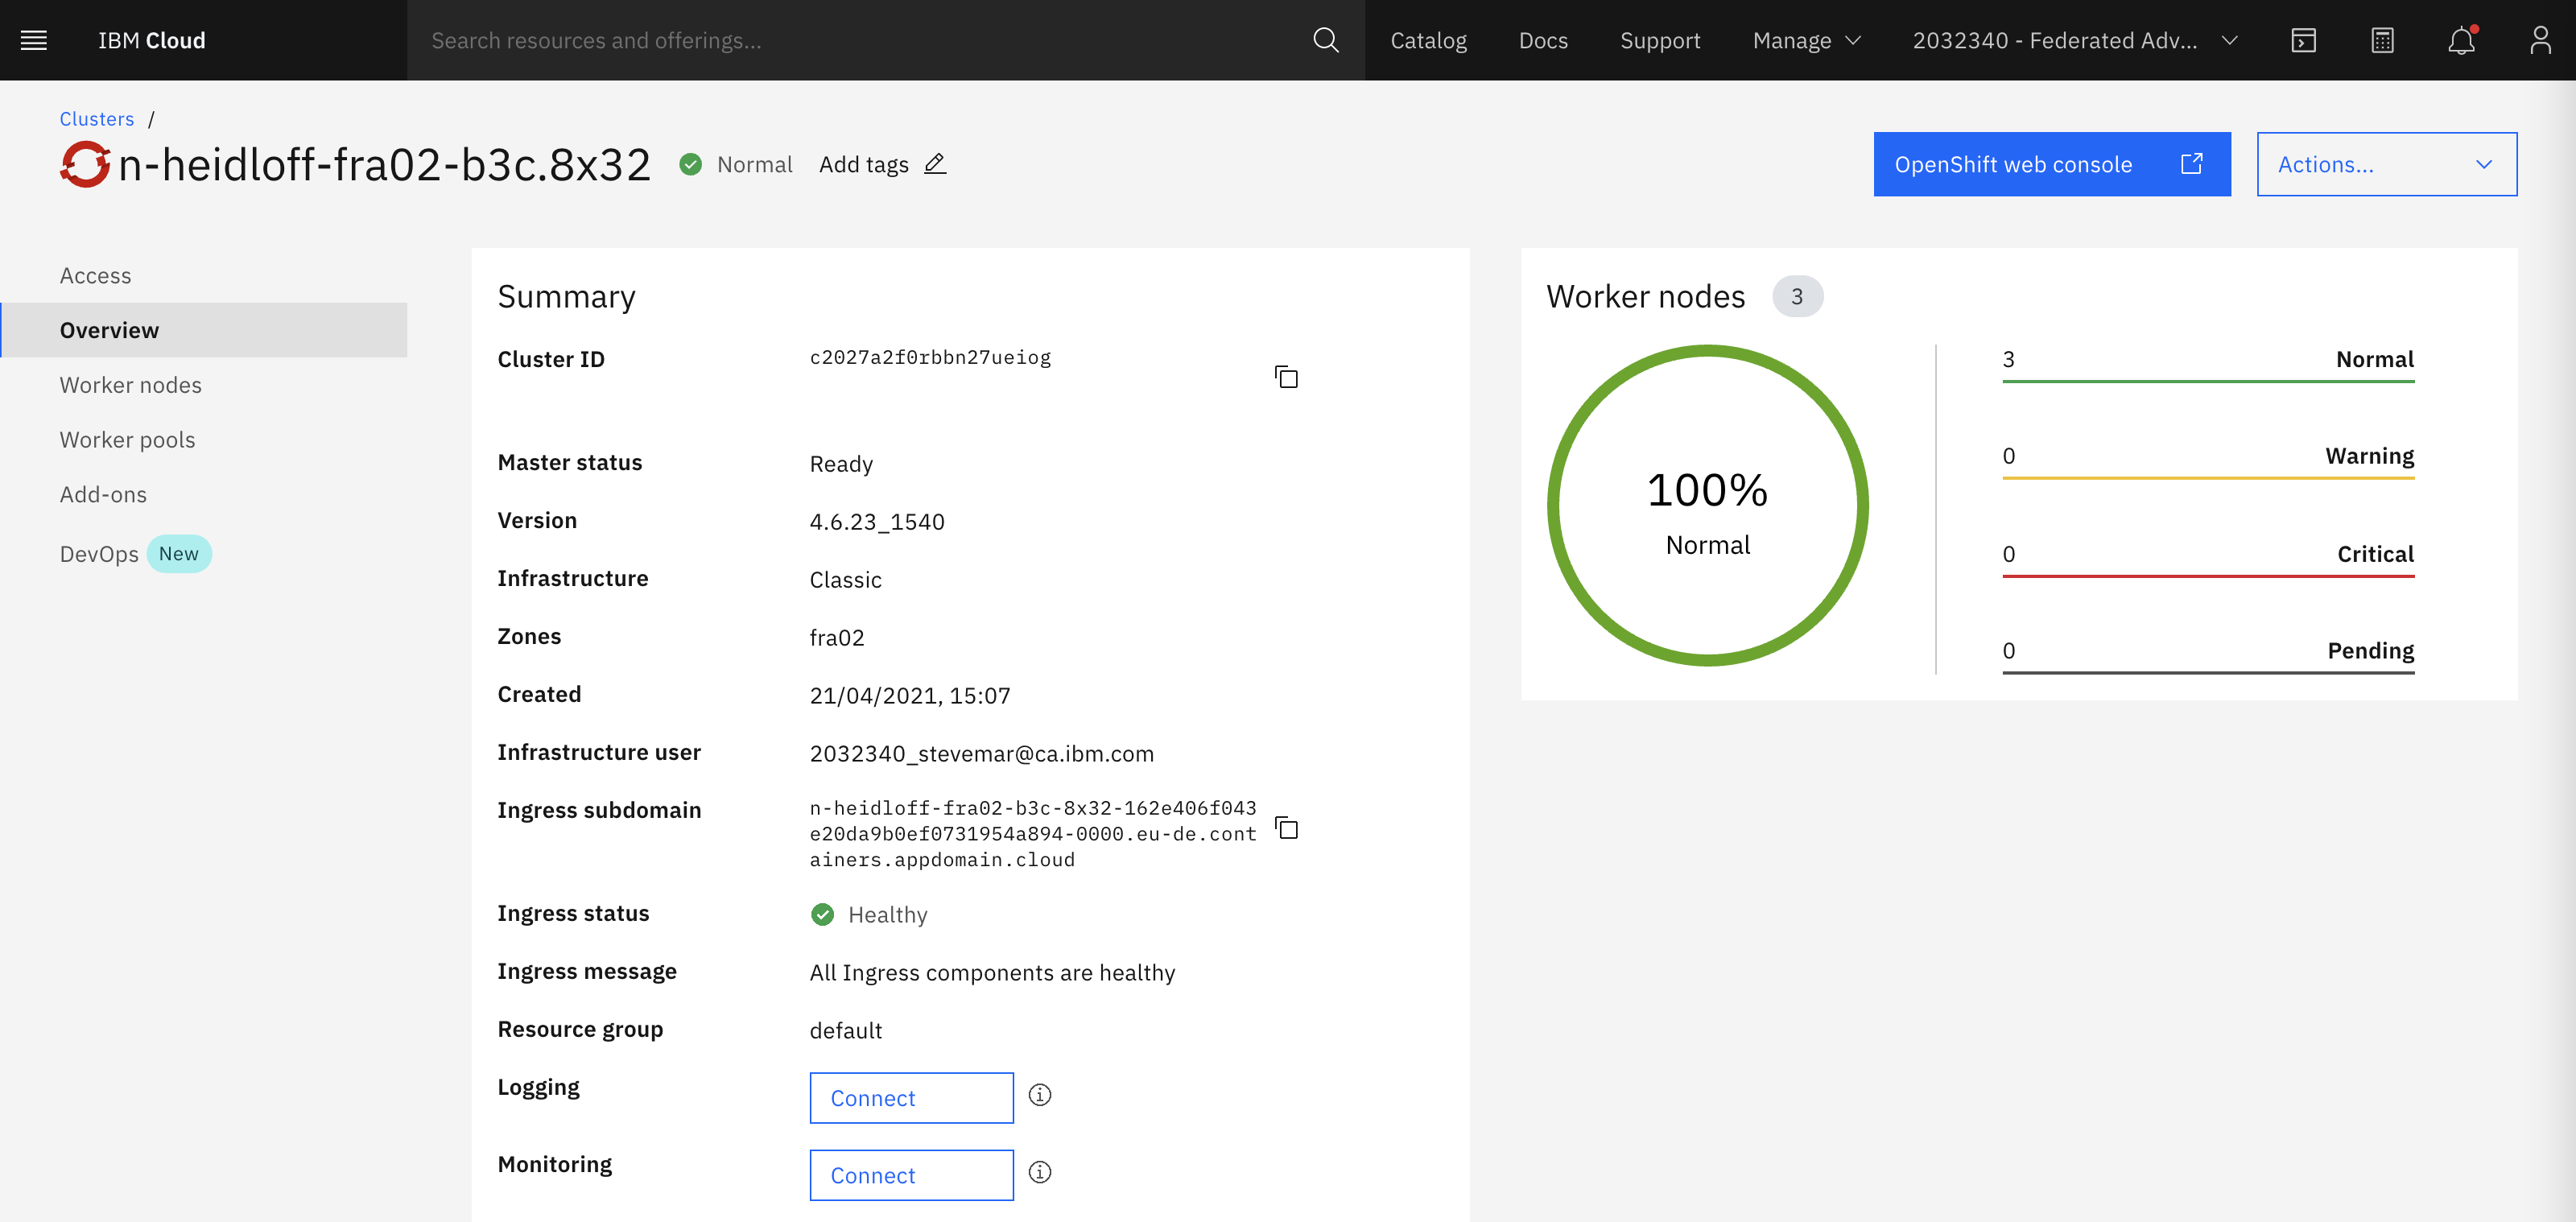
The setup is trivial. Simply click the Connect button in the IBM Cloud OpenShift dashboard.
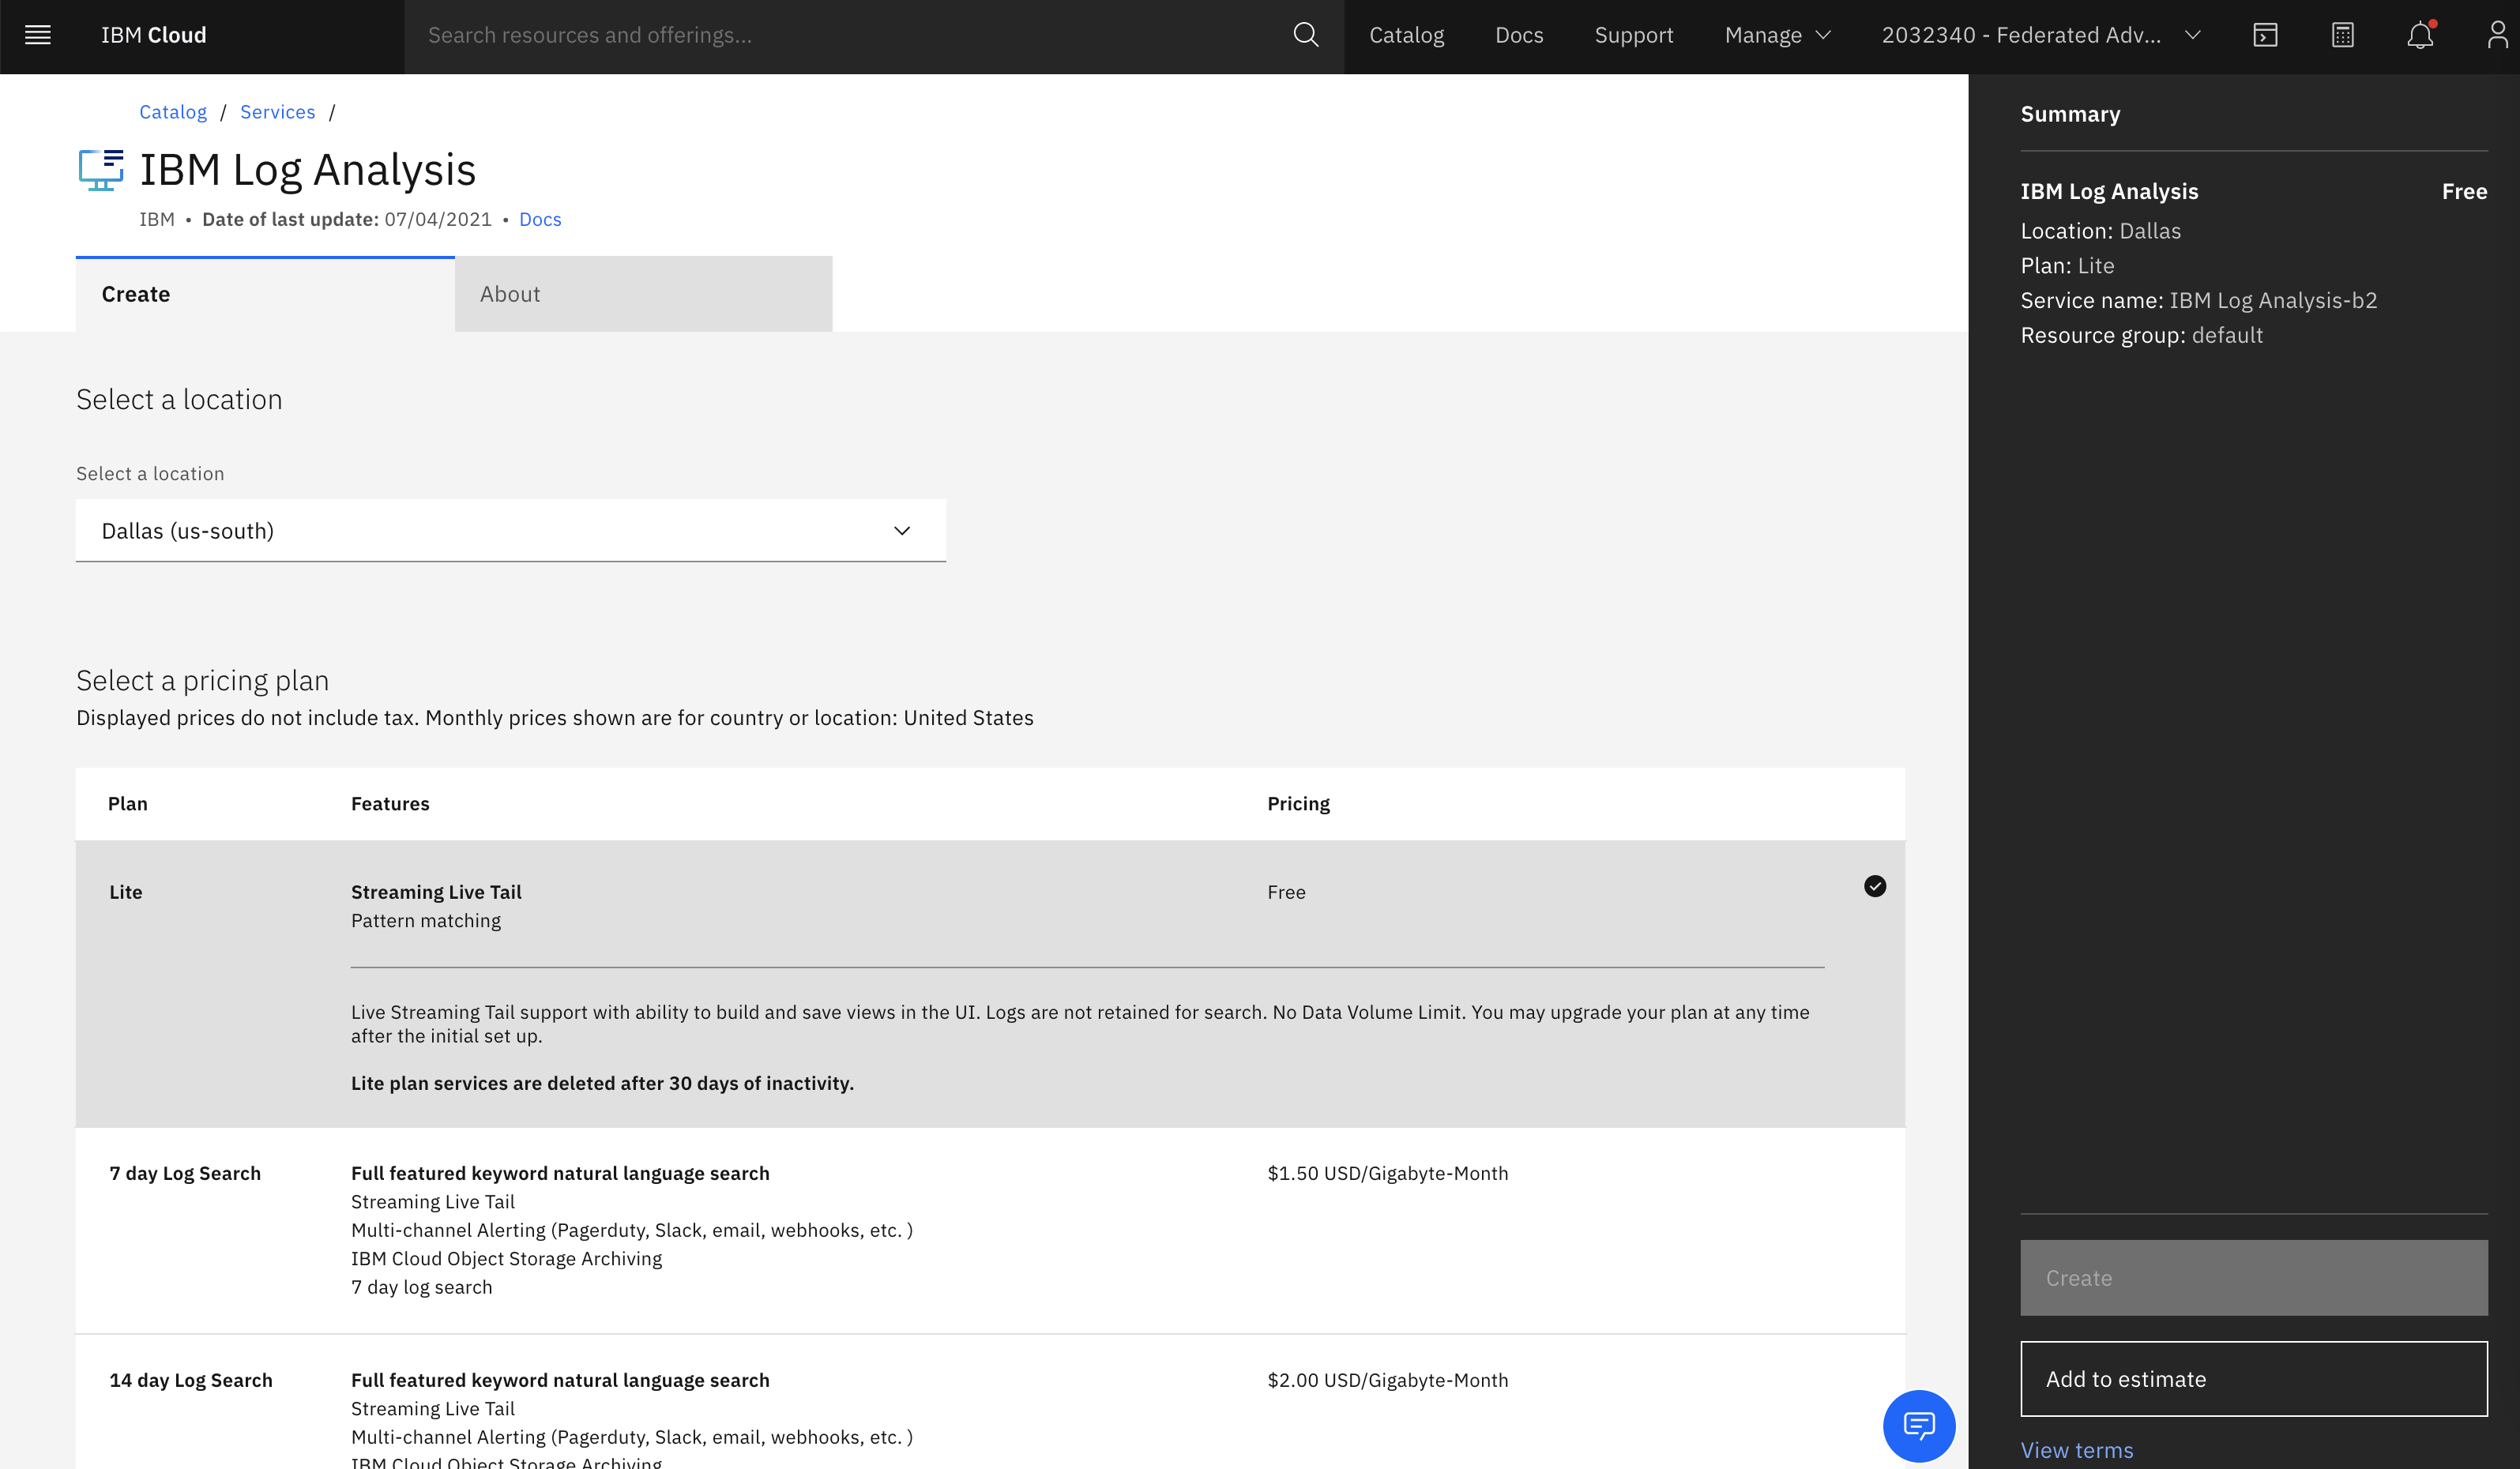
Next create a new instance.
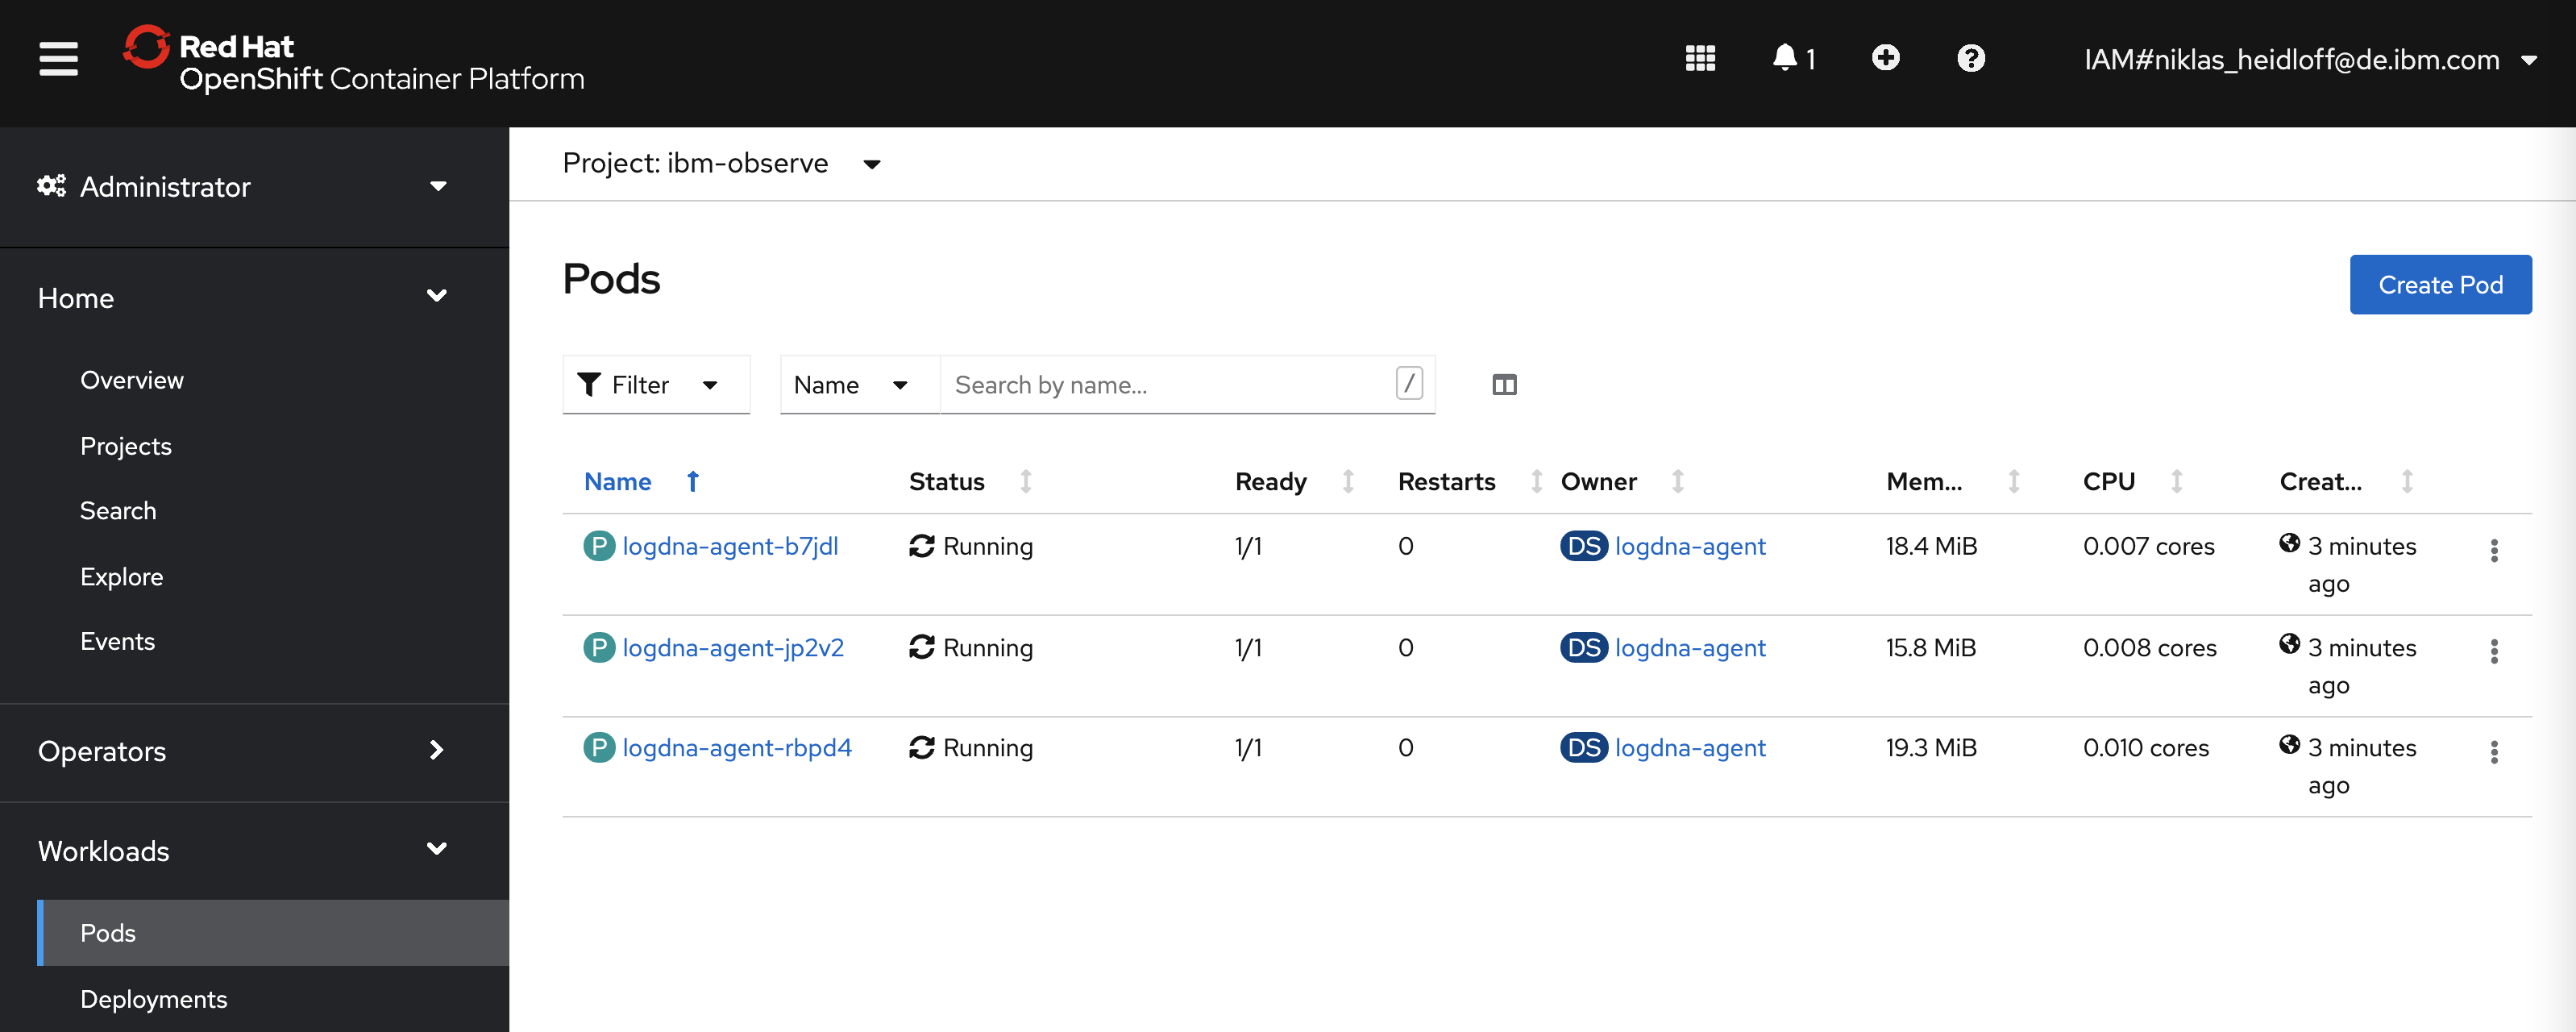
After the installation a daemon set is used to run agents from all nodes.
Usage
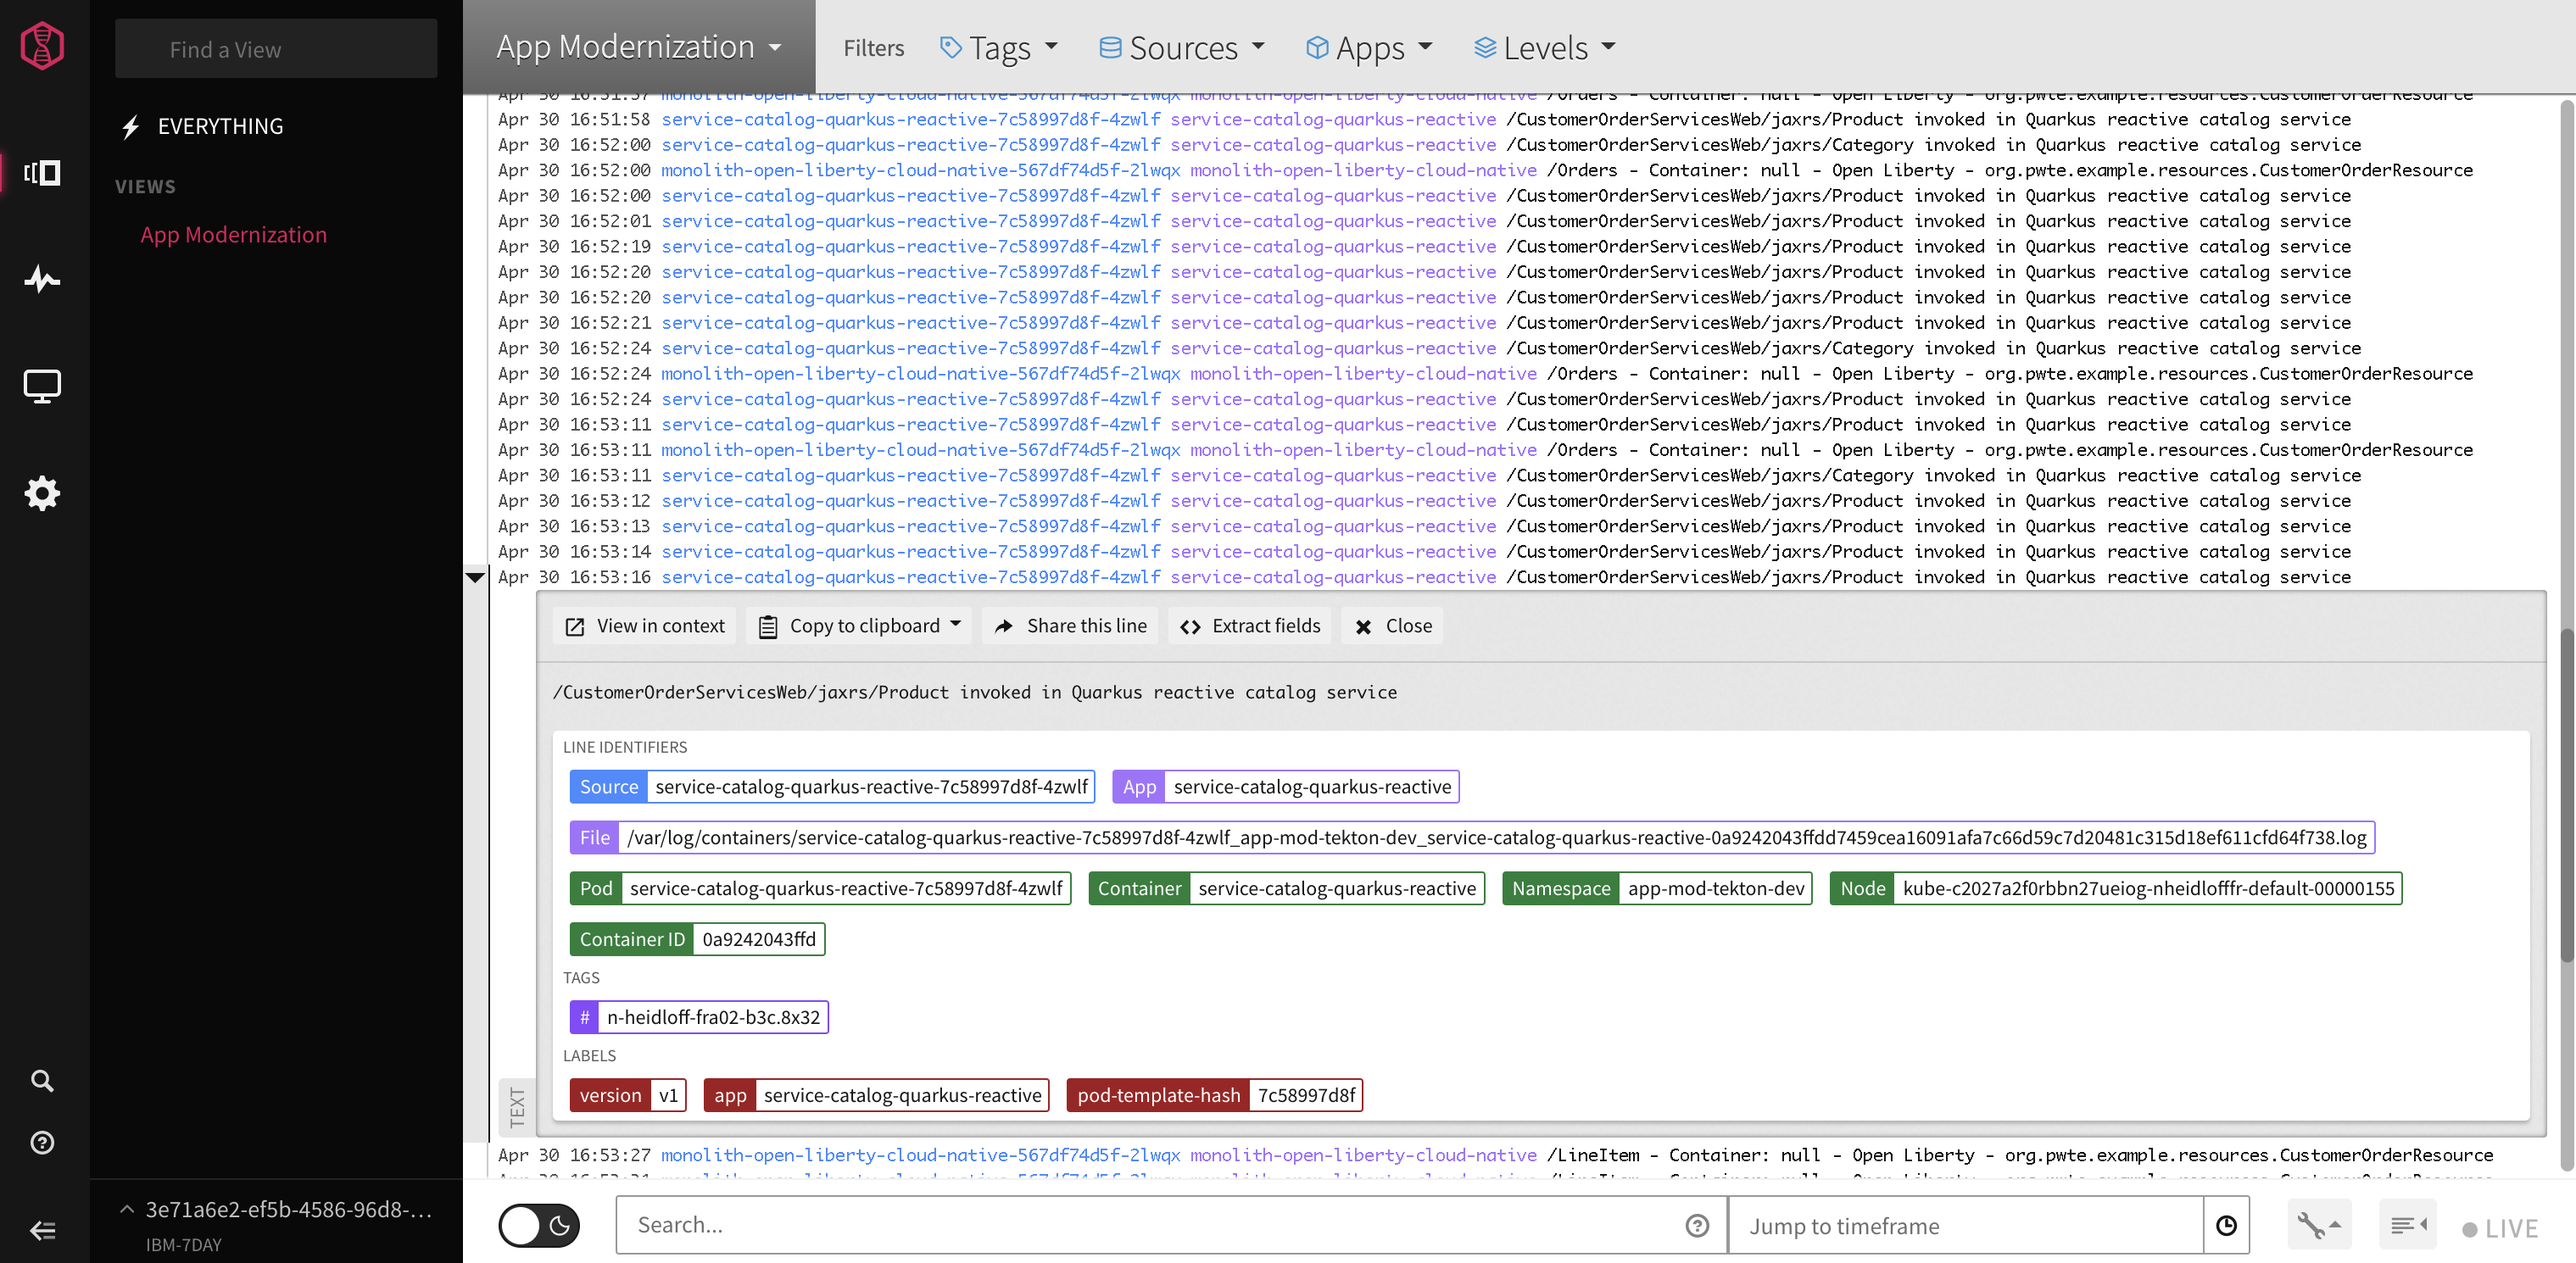
From the IBM Cloud OpenShift dashboard the LogDNA web console can be launched.
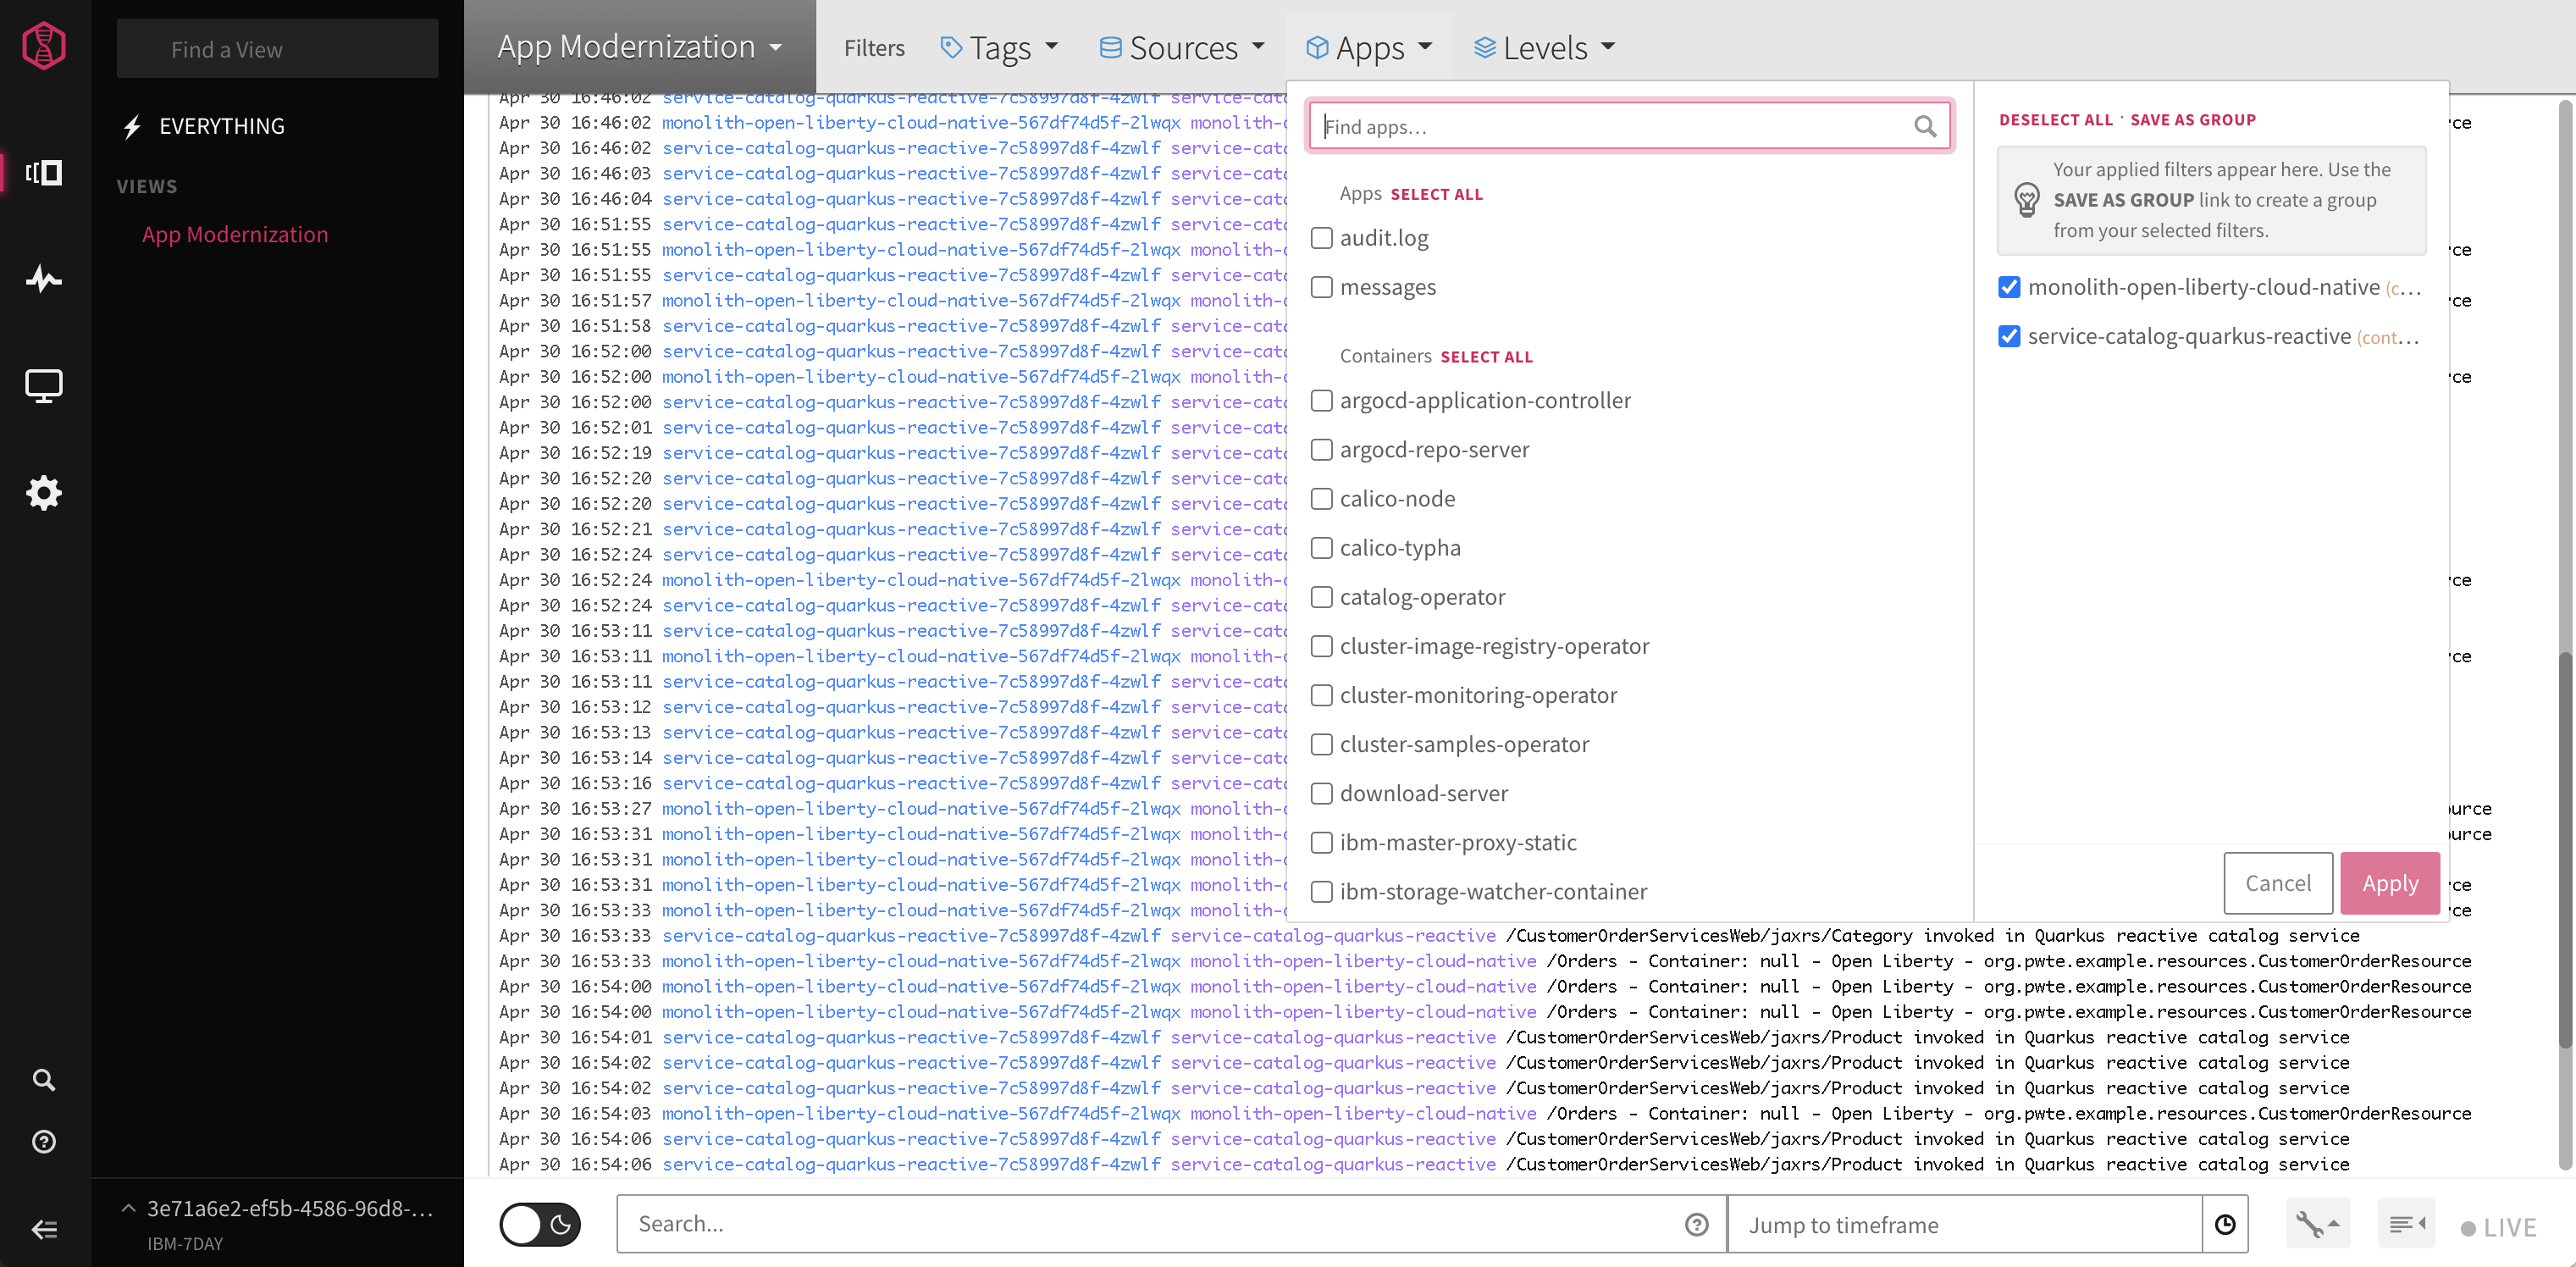
At the top filters can be defined which logs to display.
In order to display logs from my application modernization example, I’ve defined by pods as filter. As result all logs are displayed in one view. Nice! And so easy!

