
This article describes how to set up logging in Red Hat OpenShift and how to use it to see logs from microservices in one place.
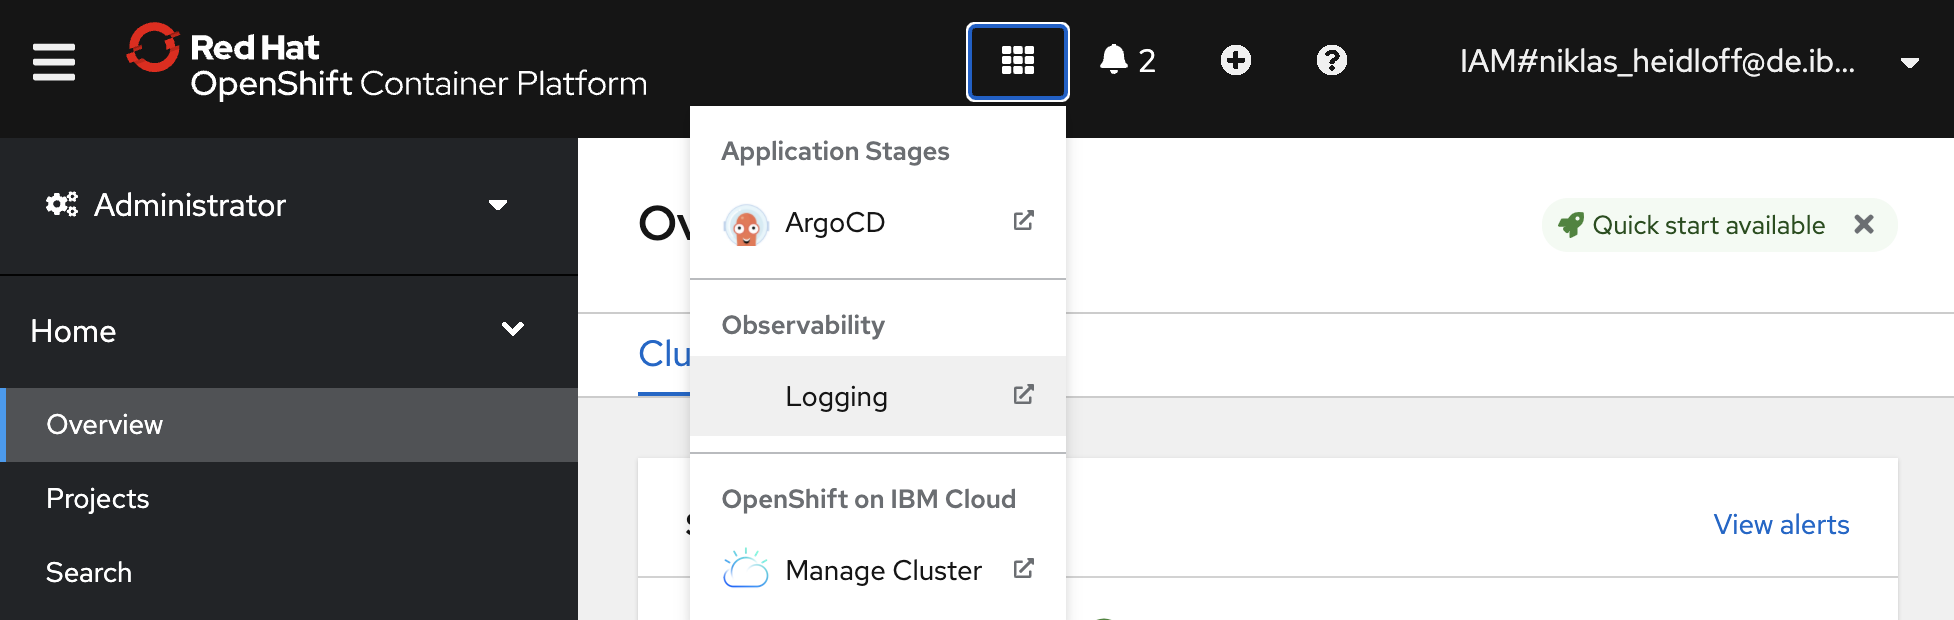
OpenShift provides logging capabilities built into the platform to aggregate all the logs from your OpenShift cluster (infrastructure, application and audit logs). When using the OpenShift console though, you might be confused, since there is no UI for logging.
In order to see the option to open the logging user interface, you need to install cluster logging first.
The documentation is pretty good and I don’t want to repeat it here. Instead I summarize the key steps and my findings below.
Install and configure Operators
First you need to install two operators:
- OpenShift Elasticsearch Operator provided by Red Hat
- Cluster Logging provided by Red Hat
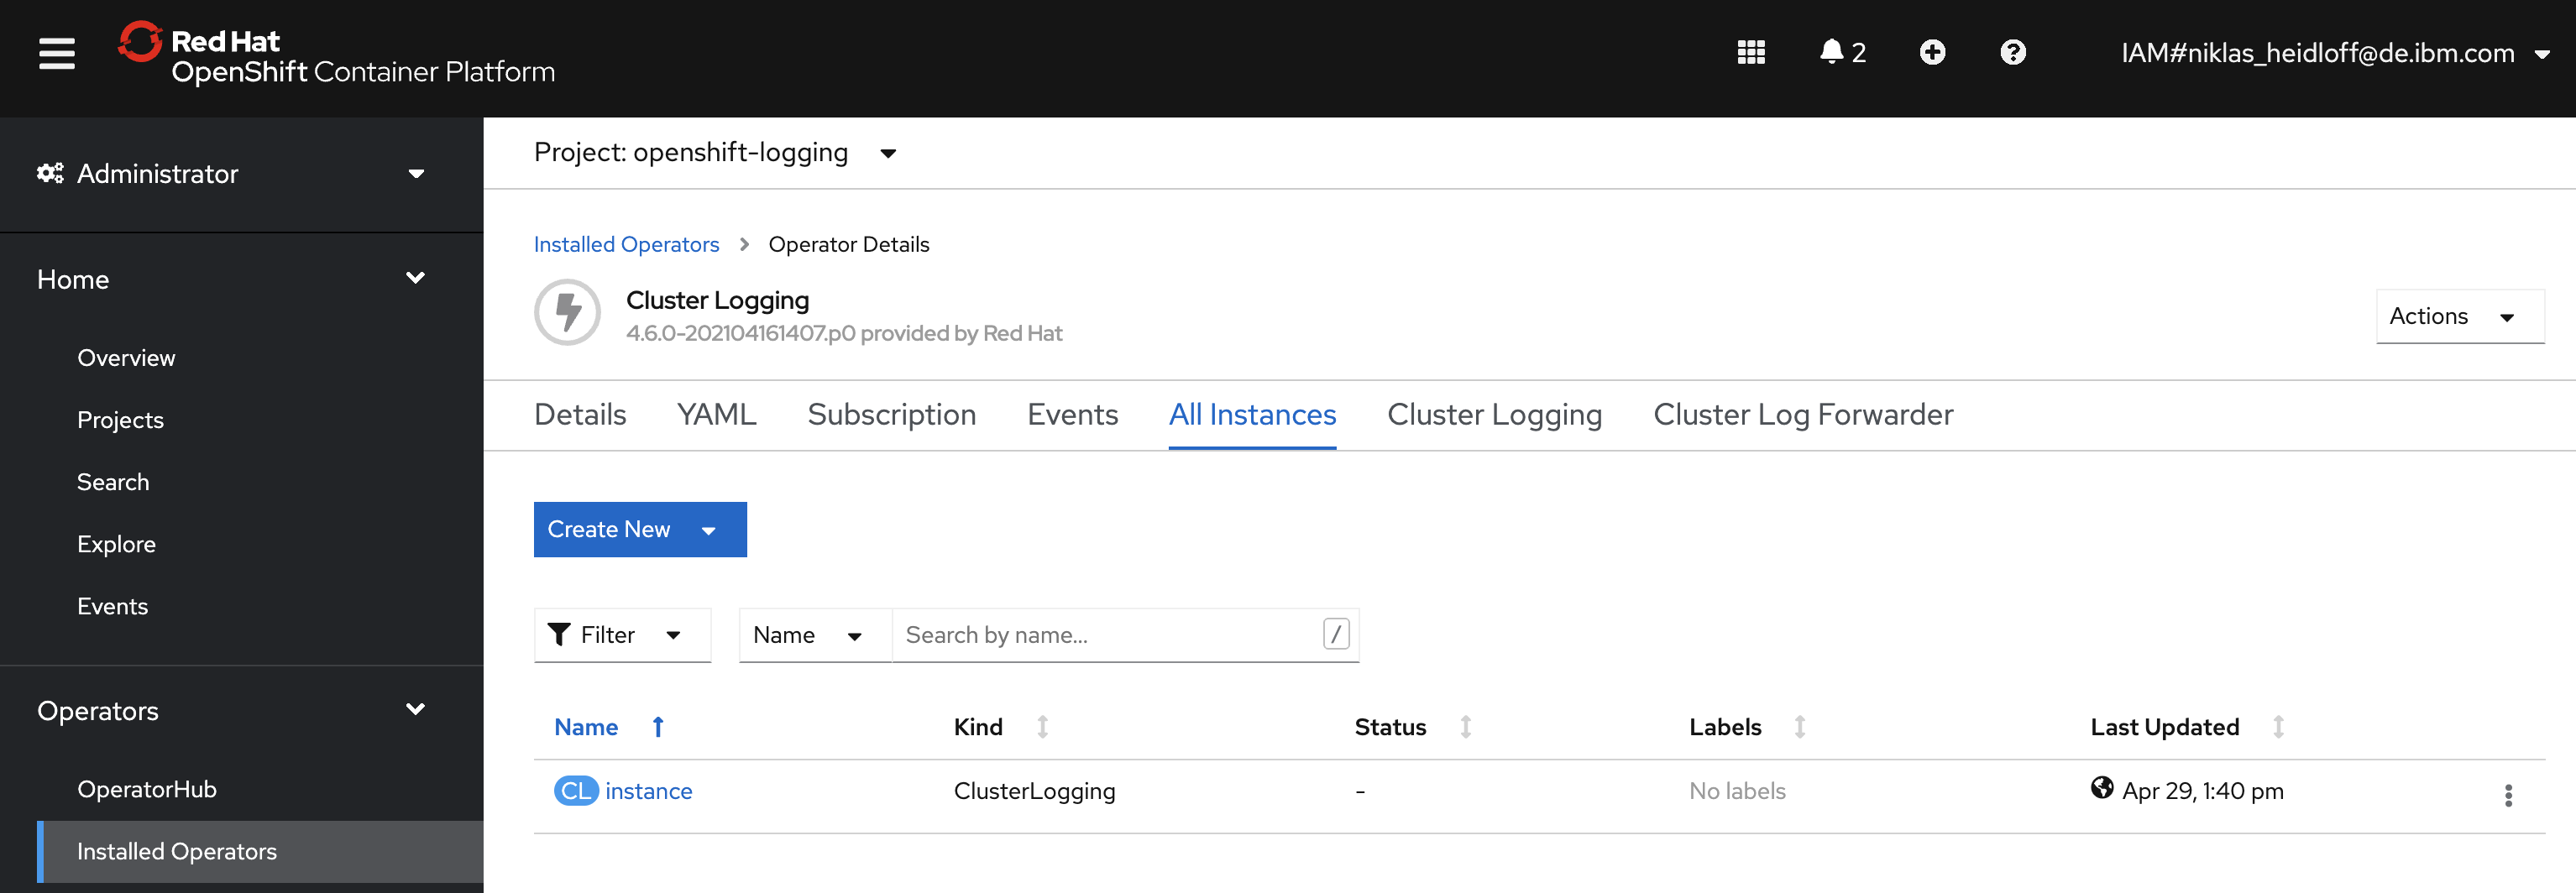
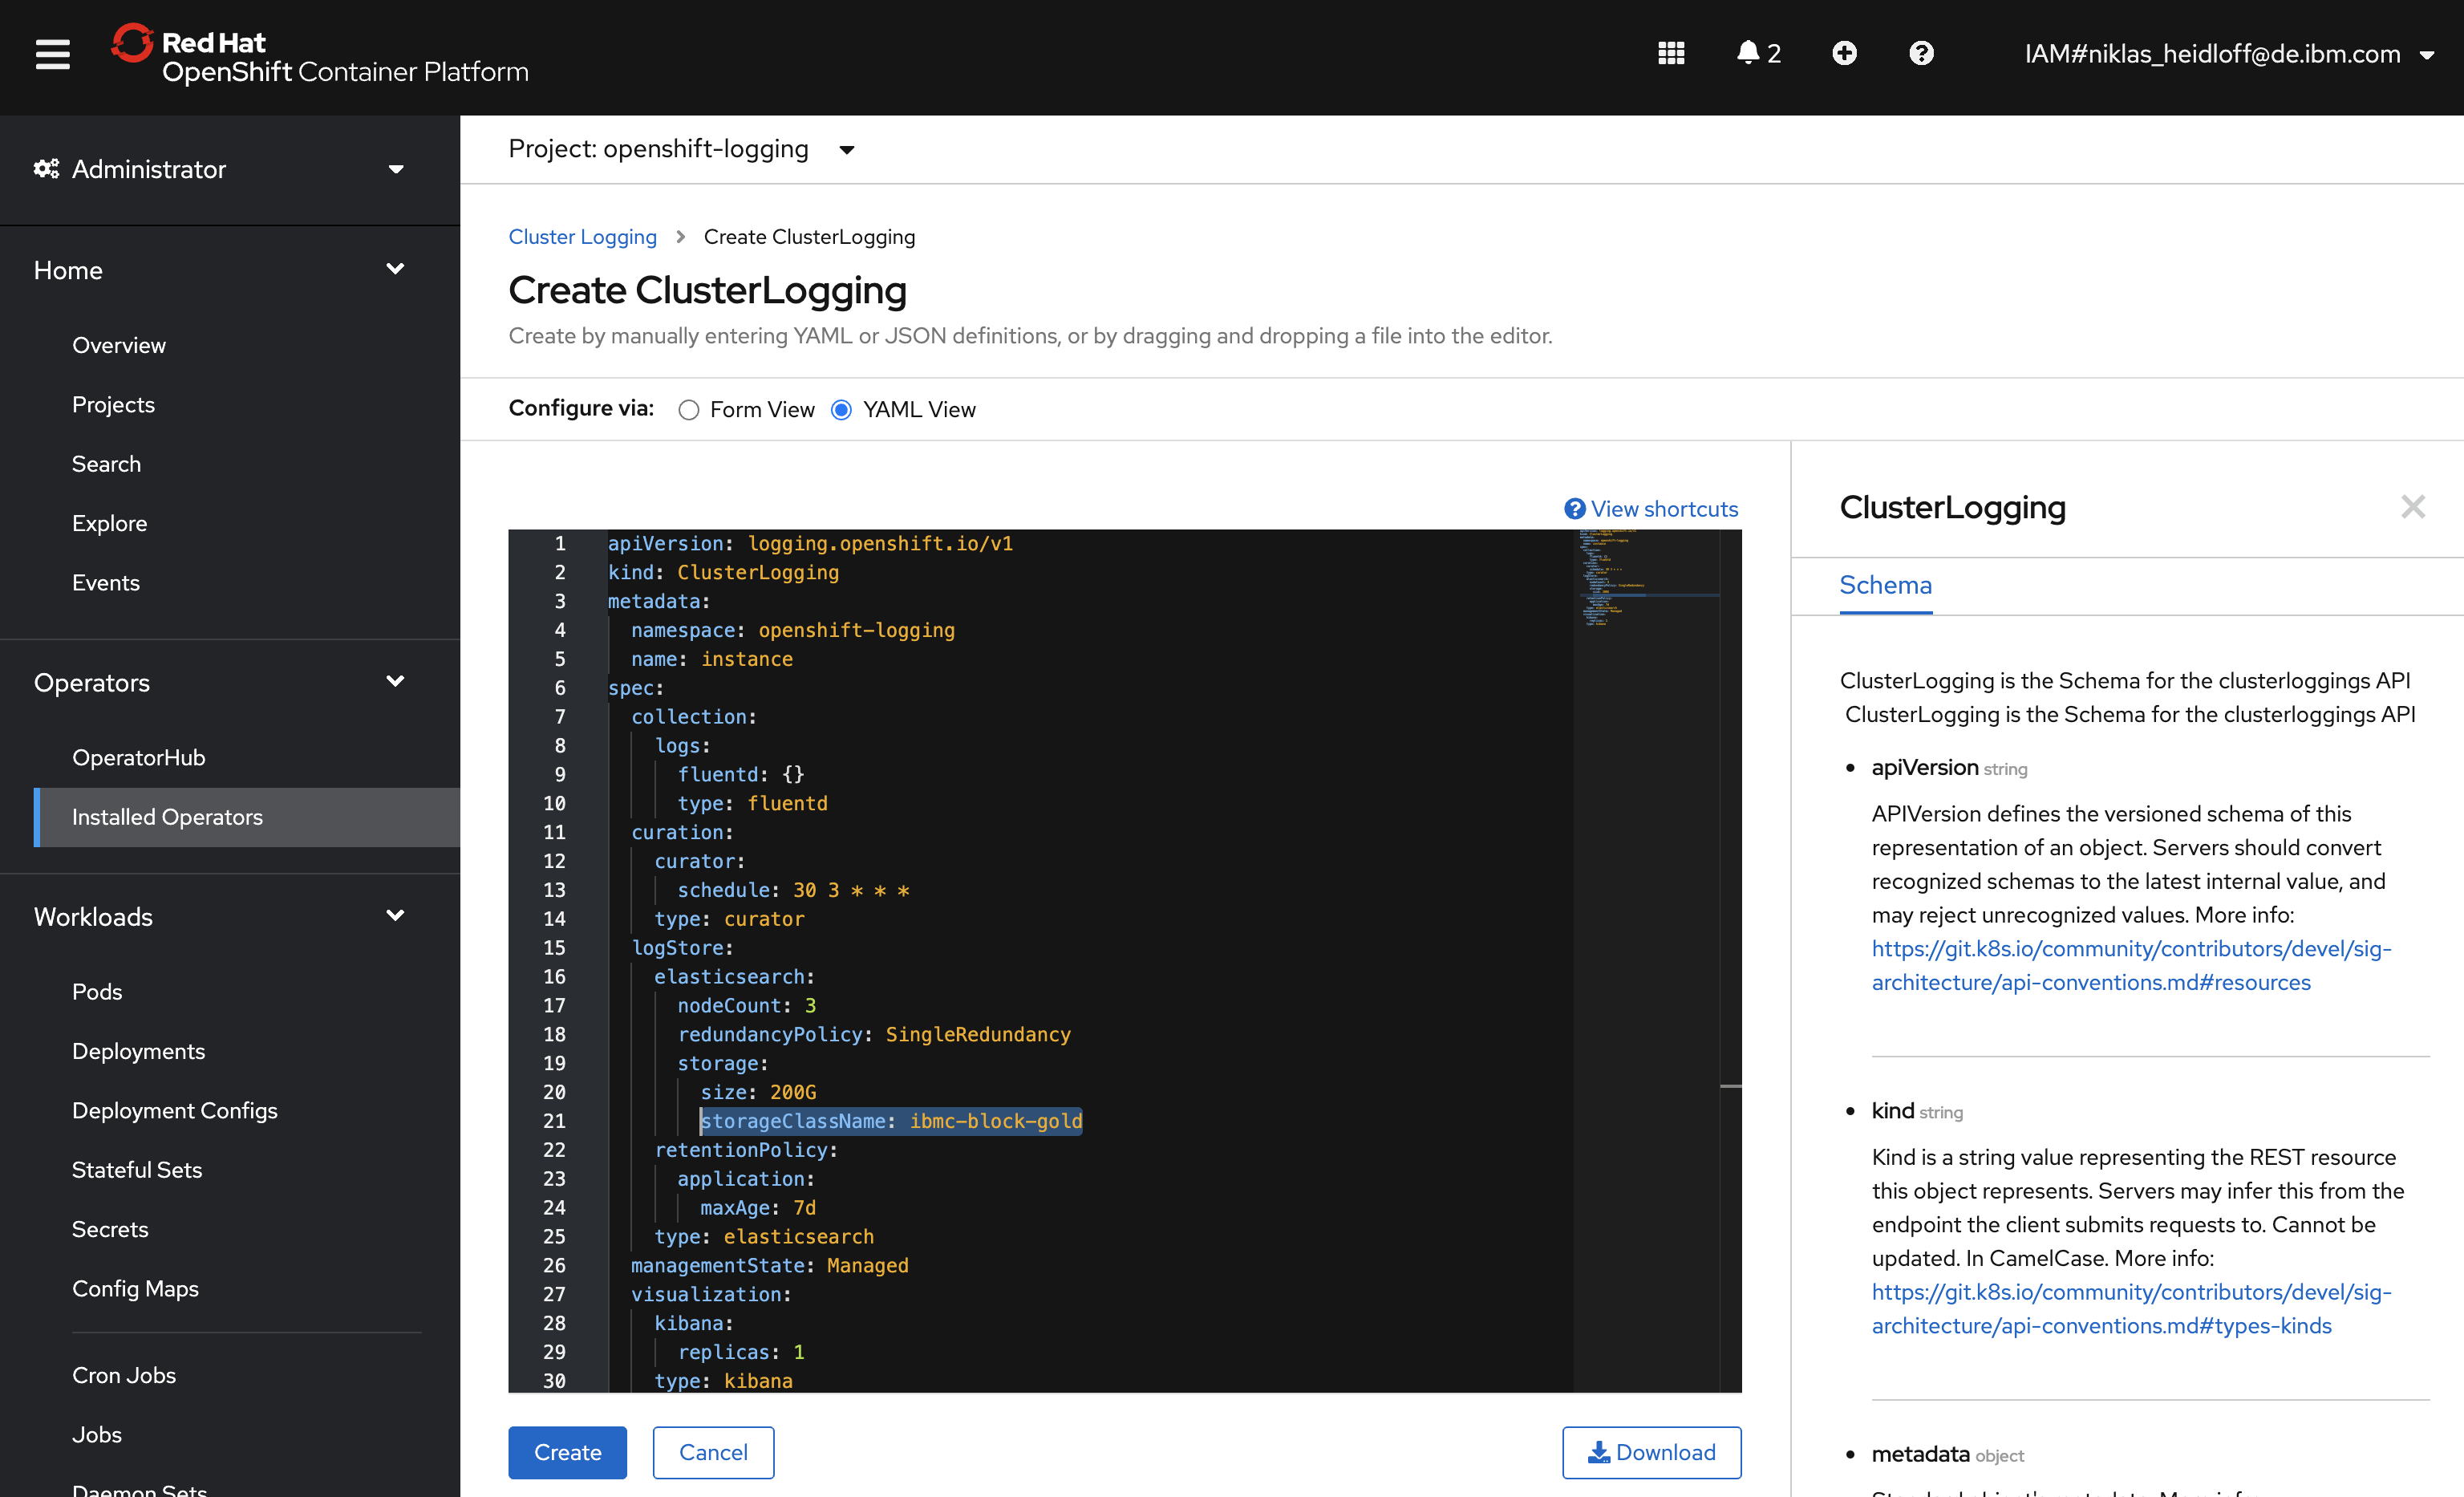
After the operators have been installed, create a new ‘Cluster Logging’ instance on the Cluster Logging operator page.
You can use all defaults, except one thing: The storage class name. If you use Red Hat OpenShift on the IBM Cloud, use ‘ibmc-block-gold’.
EFK Stack
After this you should see three running Elasticsearch pods, three Fluentd pods and one Kibana pod. Note that the Elasticsearch pods require a lot of memory.
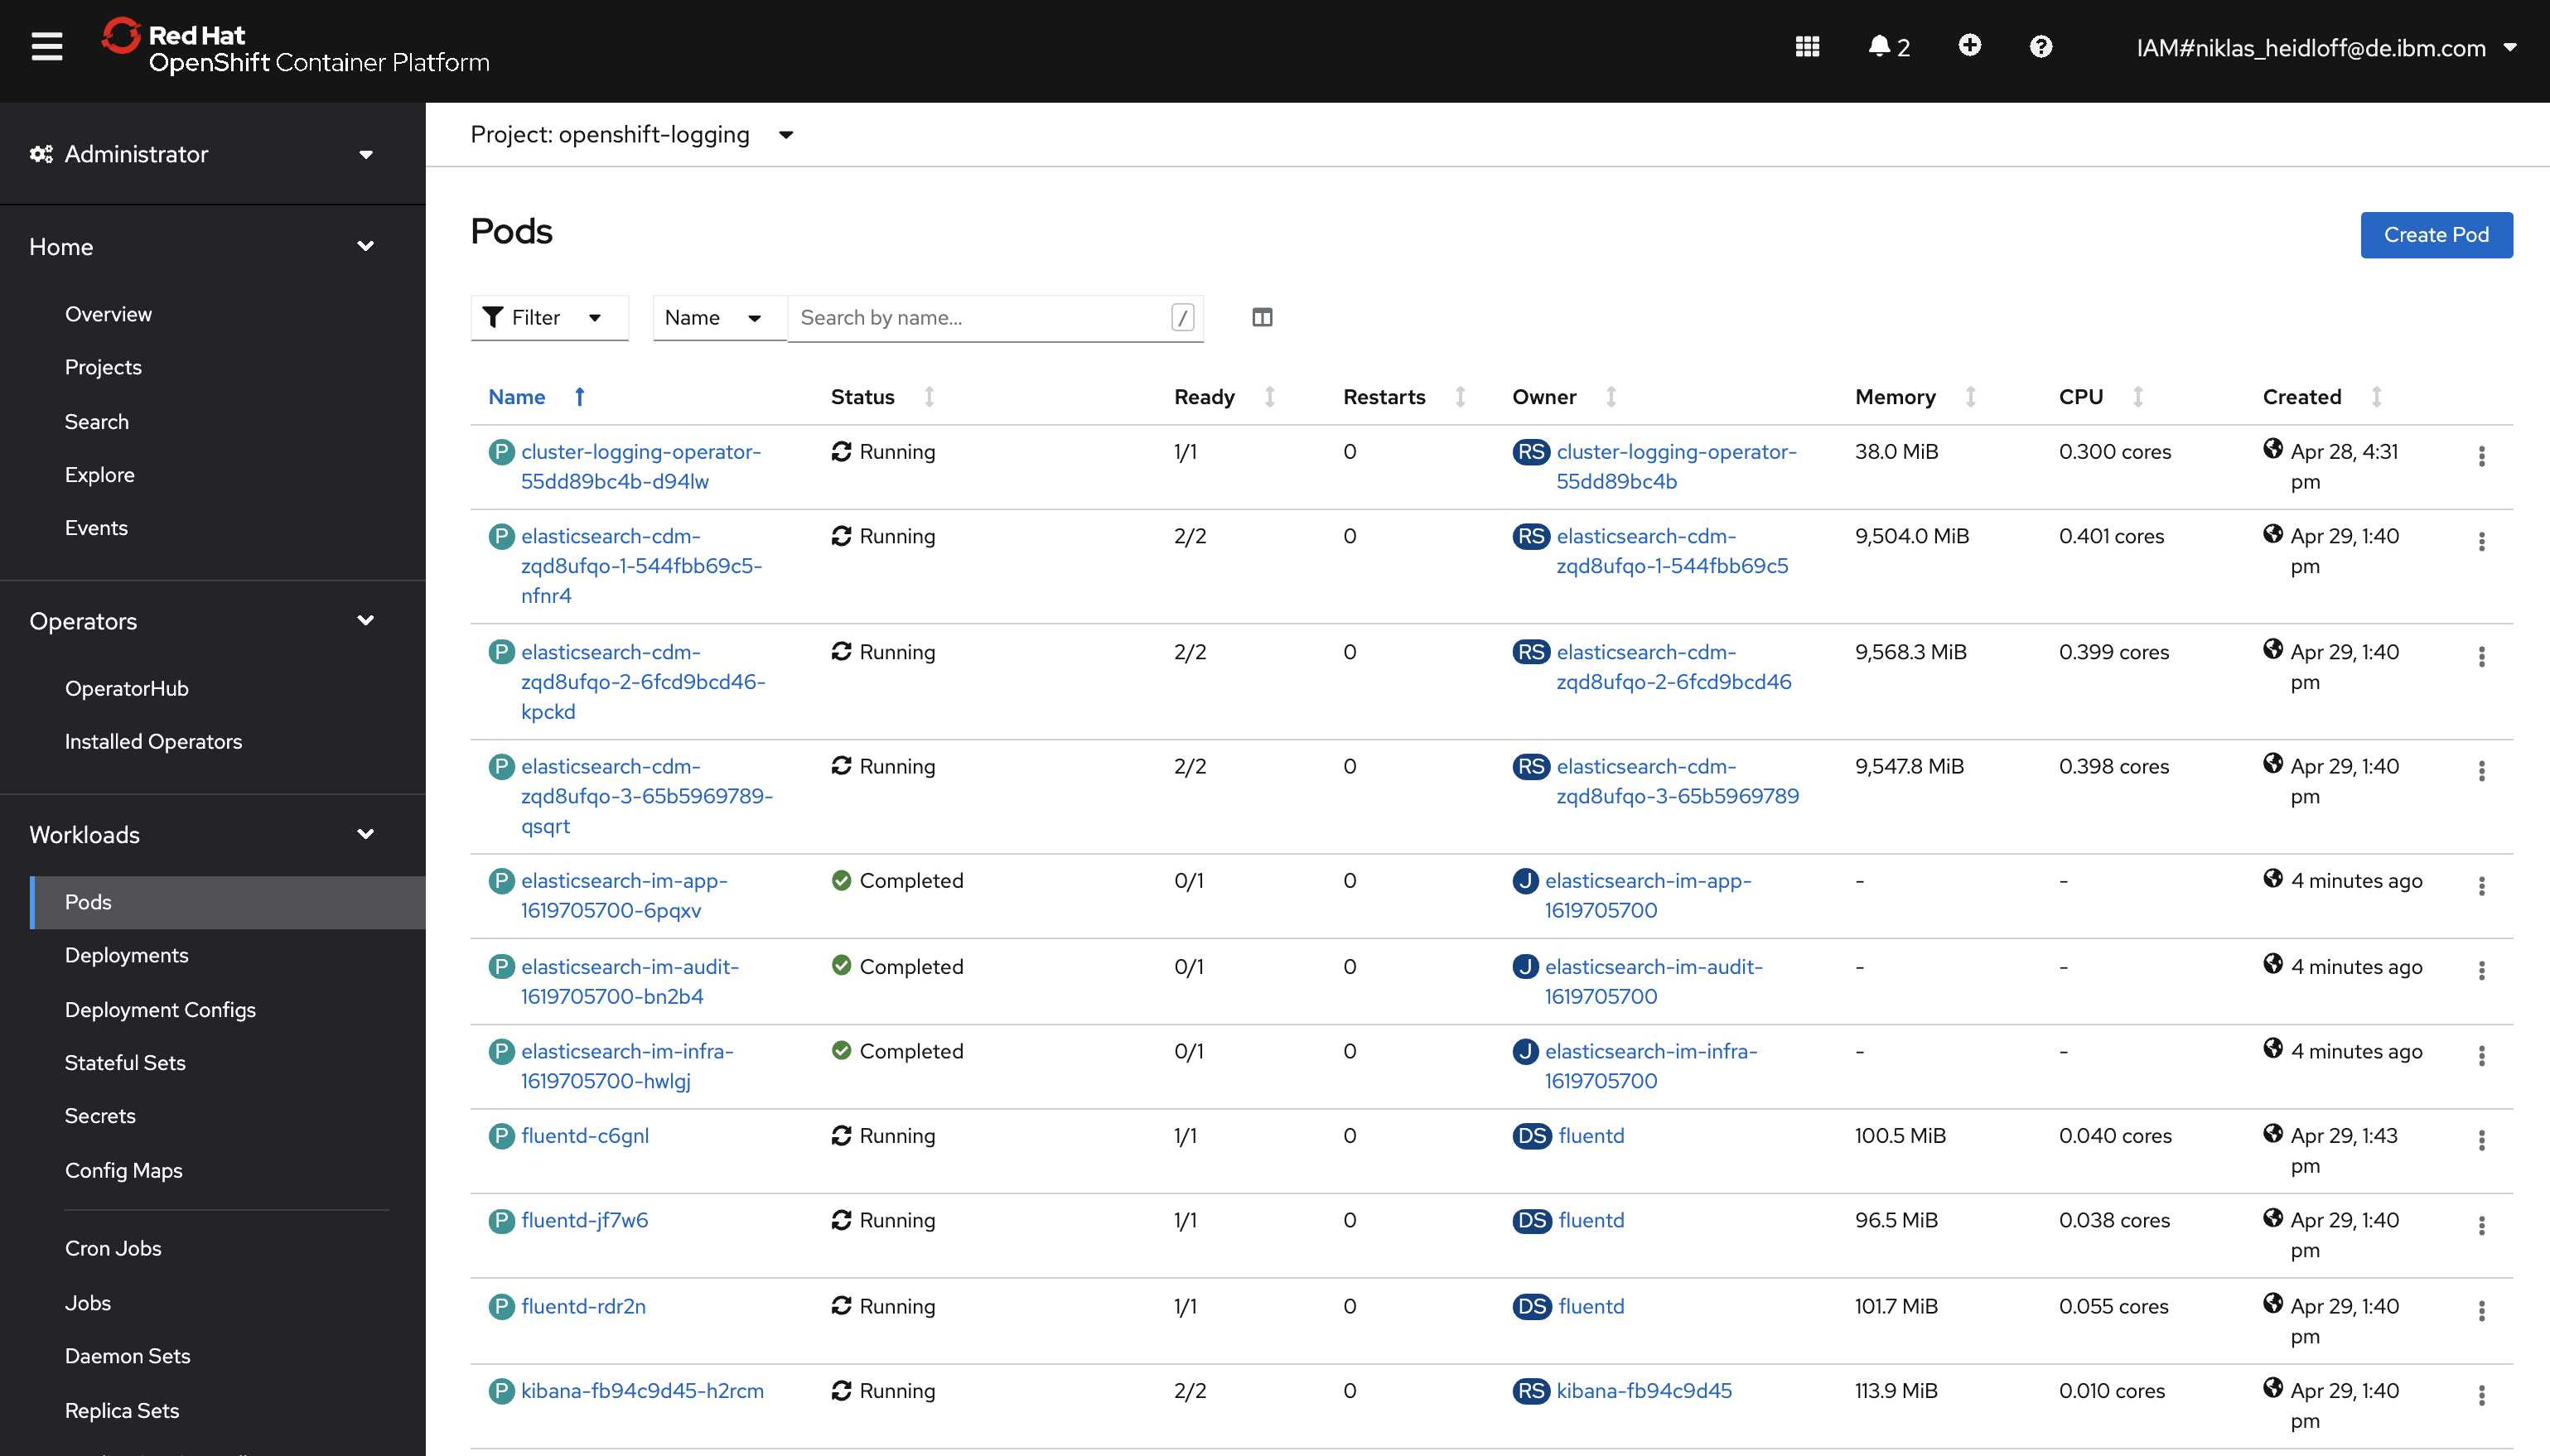
OpenShift uses the EFK stack with three components:
- Elasticsearch is the datastore which provides search and aggregation capabilities
- Kibana is the user interface to view logs
- Fluentd is the log data collector which can send logs to various targets (default is Elasticsearch in OpenShift)
Viewing Logs
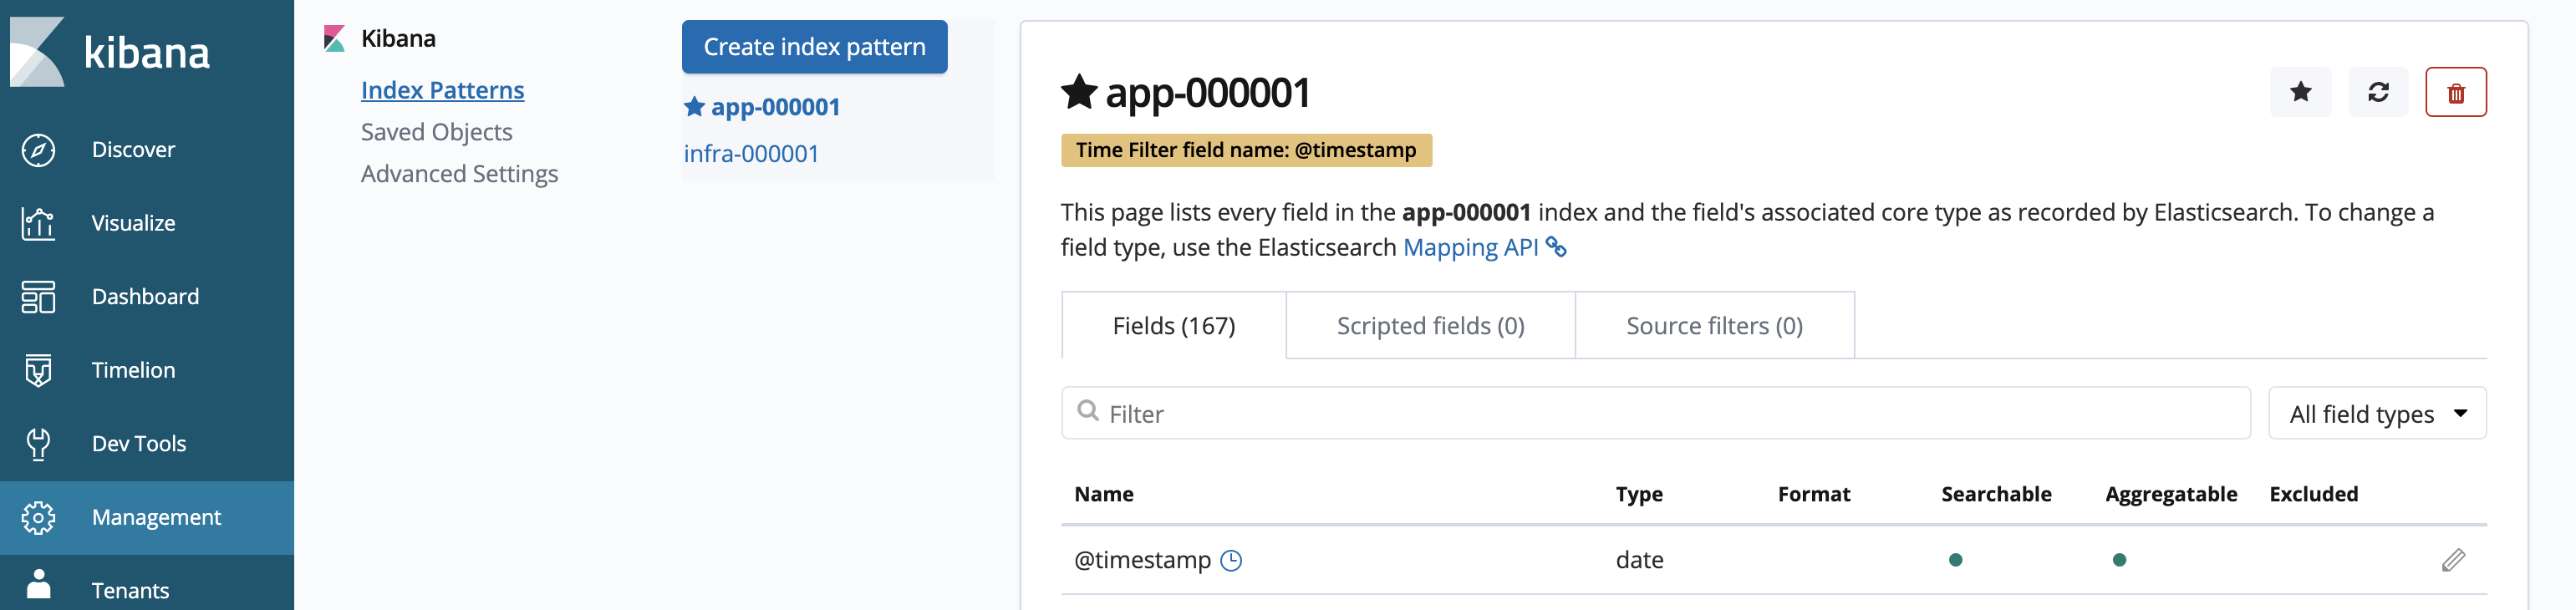
Kibana is a data visualization dashboard software for Elasticsearch. Before it can be used some minimal configuration needs to be done. You need to define the indexes for application and infrastructure logs.
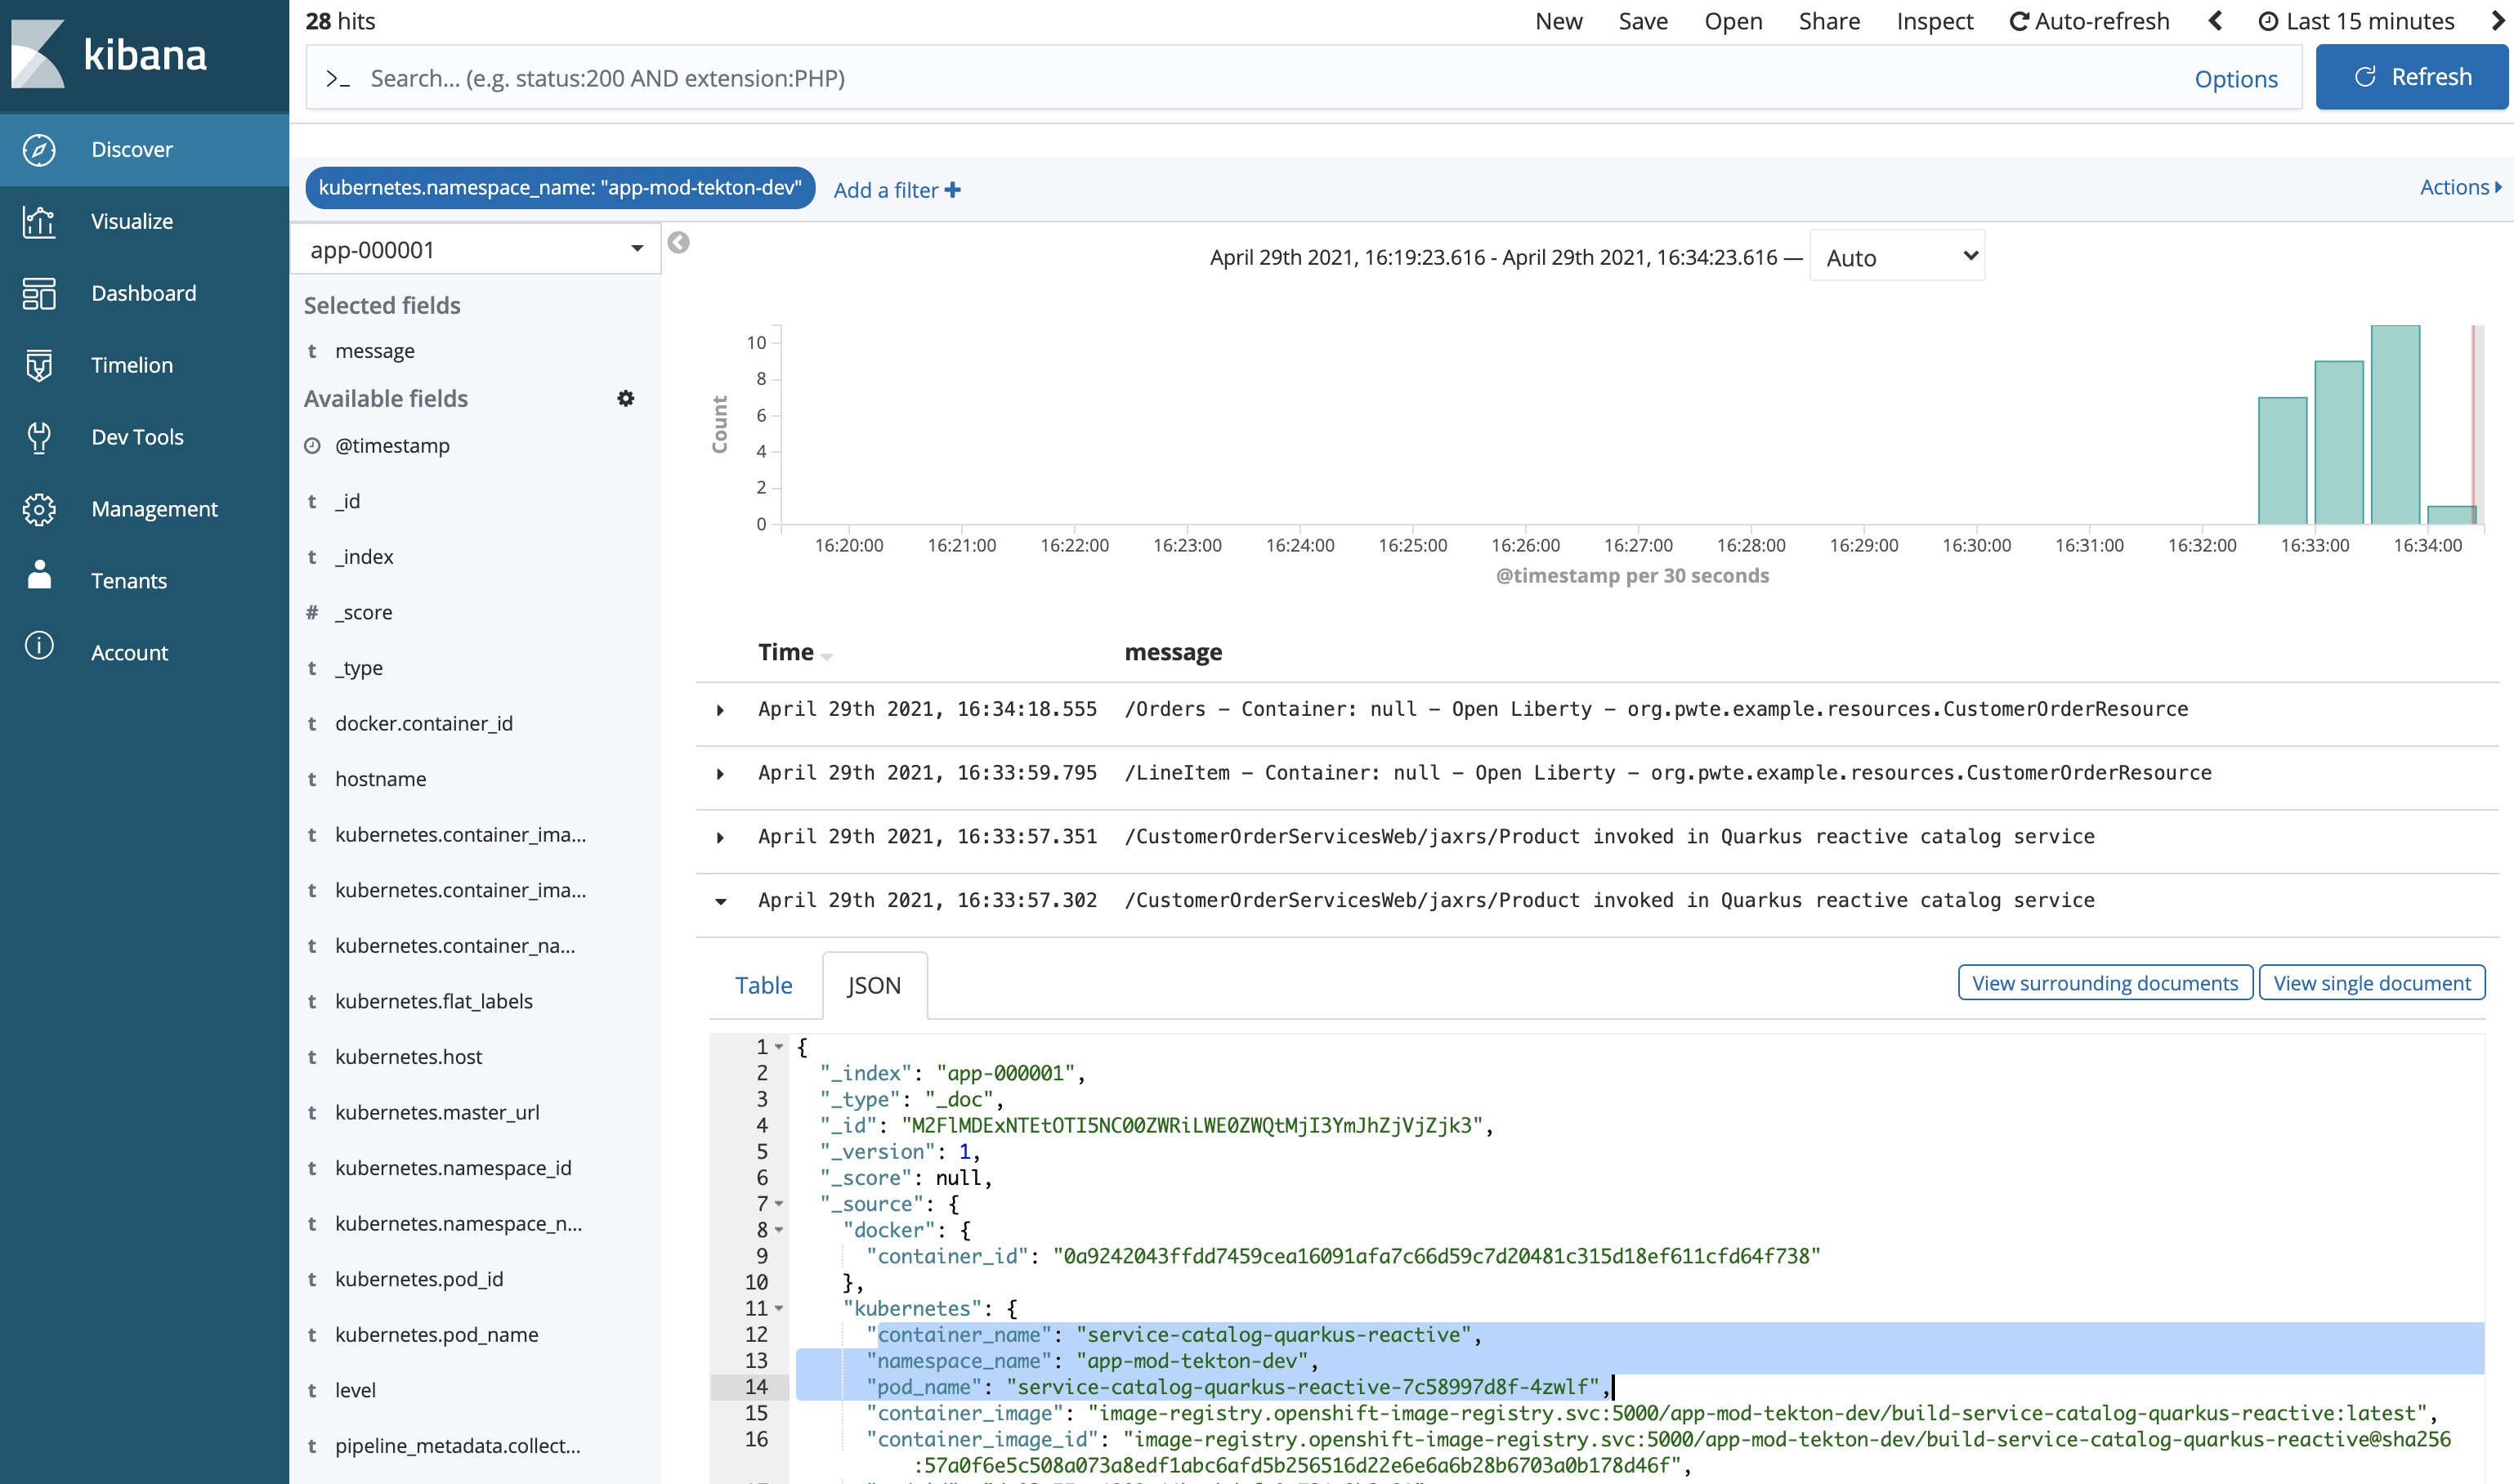
On the Discover page you can refer to these index patterns. For application logs choose your app index. In the screenshot below the logs of my application modernization example are displayed.
All microservices of my sample run in the same OpenShift project which I use as filter. To make the entries in the right column more readable, I selected ‘message’ as the field to be displayed. OpenShift logging (or Fluentd to be more precise) reads and forwards all container logs from /var/log/containers/*.log which are the standard outputs and errors.
The screenshot shows the logs of my two microservices in one view.
Alternatives
There are good reasons to run the complete logging system within your own cluster.
Alternatively you could also consider not to use Elasticsearch in your OpenShift cluster, but other external sources. OpenShift provides various options for third party solutions. An advantage of these options could mean less work since several of these options are available as managed services. Plus you wouldn’t need to dedicate that many resources to run Elasticsearch within your cluster.
Yet another alternative is to use the logging capabilities hyperscalers provide. For example IBM Log Analysis is a service that IBM offers for OpenShift on the IBM Cloud as well as for other IBM services.