Developers need to do more than writing code. DevOps, operations and observability are essential to build and run software. To efficiently operate applications, IBM provides an observability tool called Instana.
To find out more about Instana, read my other posts:
- Observing Java Cloud Native Applications with Instana
- Getting Alerts from IBM’s Observability Tool Instana
What is IBM Instana Observability?
Boost functionality and observability in your enterprise application performance monitoring (APM) with IBM Instana. Improve application performance management and accelerate CI/CD pipelines no matter where applications reside — public cloud, private cloud, hybrid cloud, on premises, IBM Z and more. With IBM Instana Observability, users can combine APM with automation capabilities and distributed tracing to deploy on premise or as a SaaS solution.
Let’s take a look how to try Instana. There is a trial version. You can install Instana on your own infrastructure or use it as SaaS.
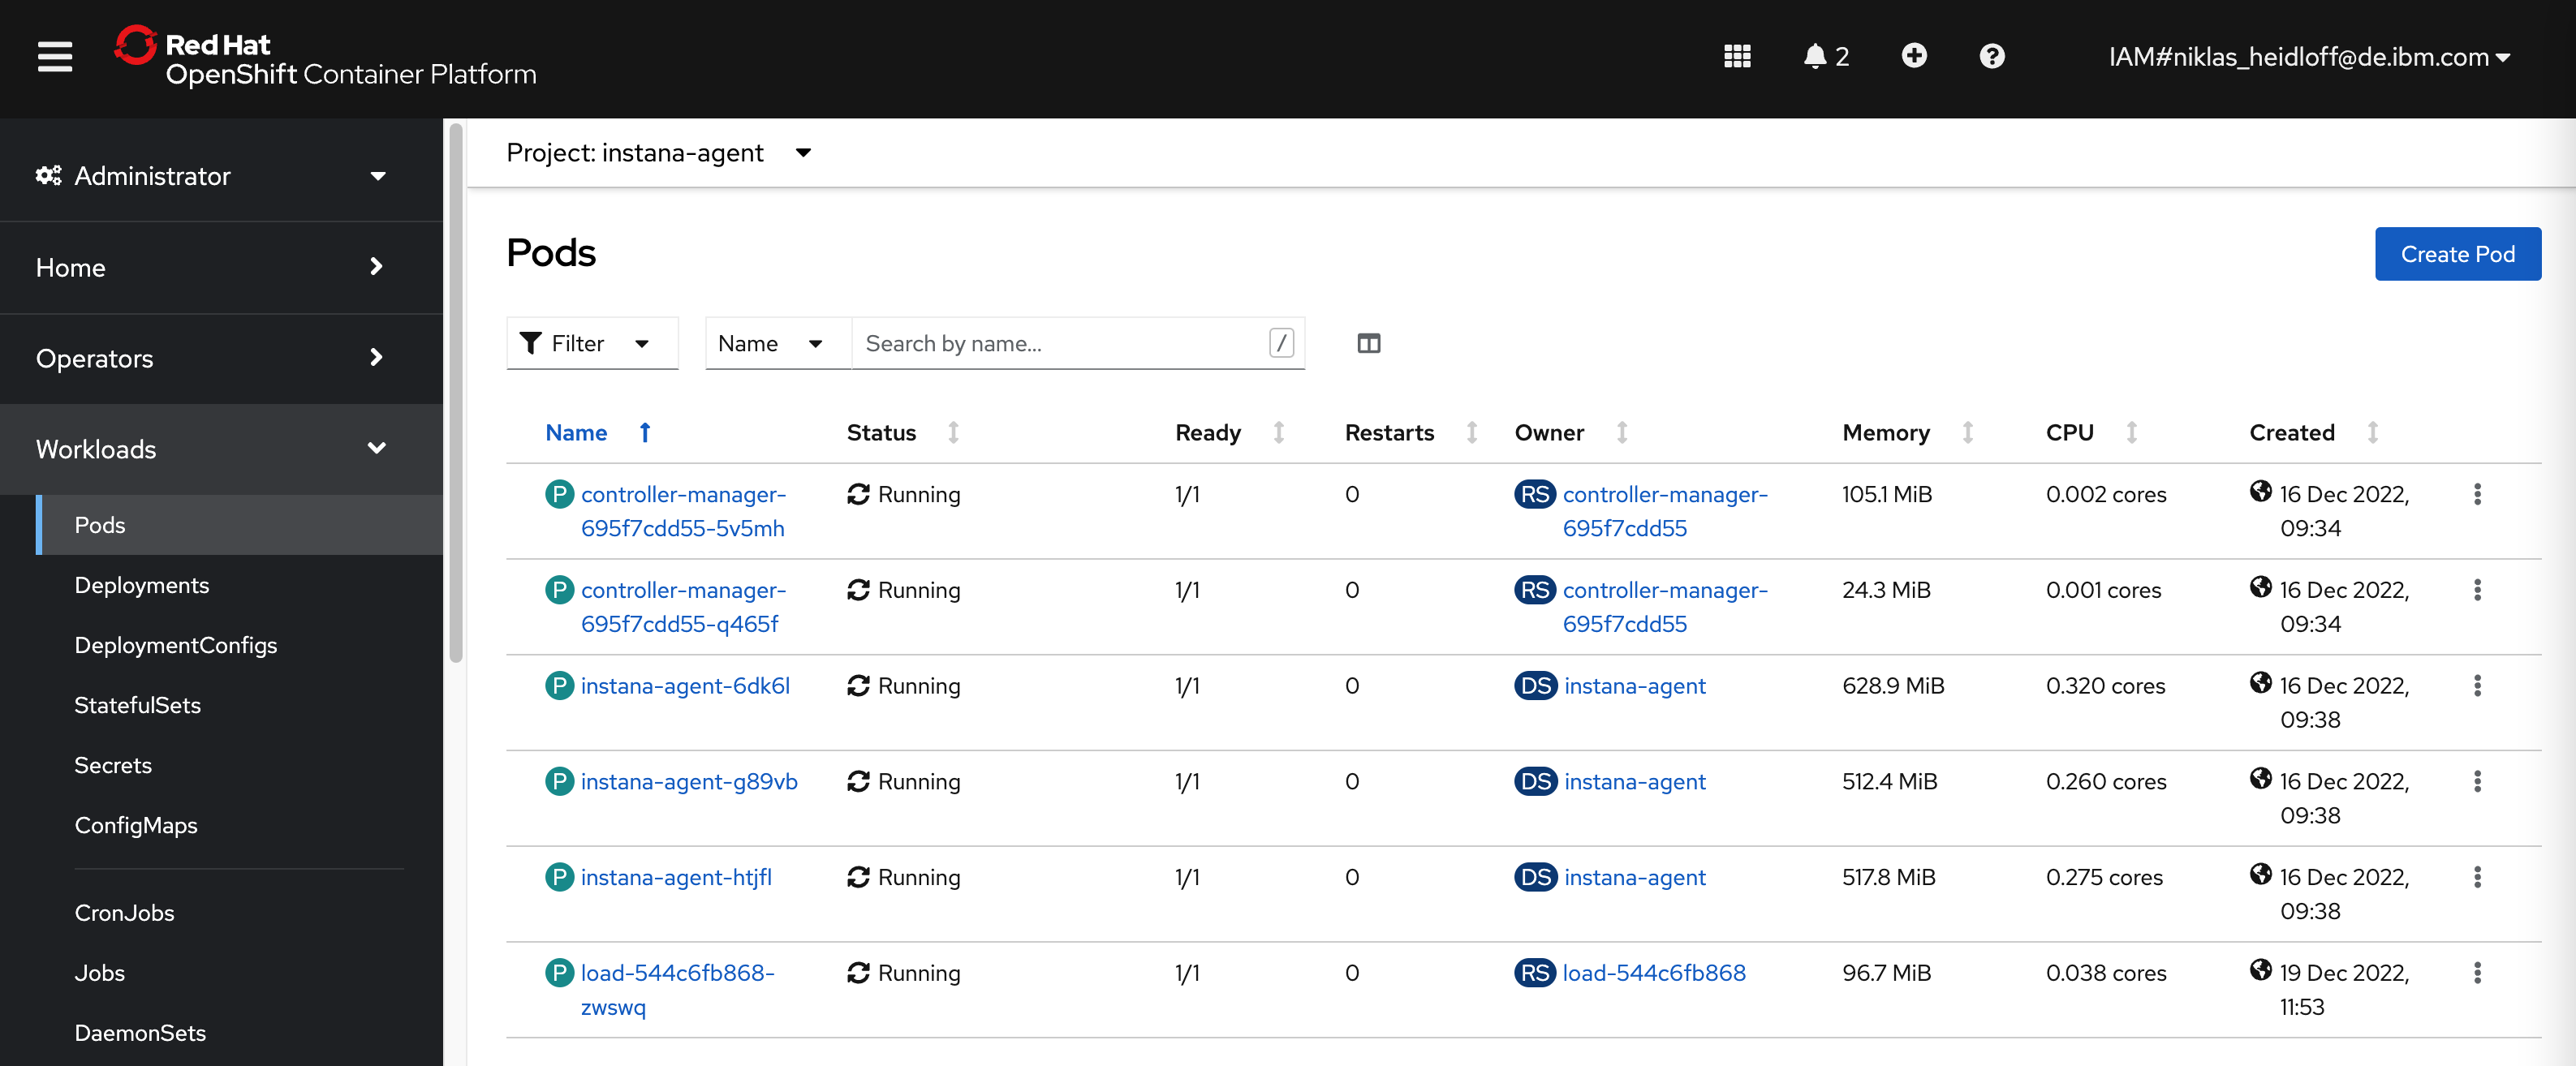
To observe your own Kubernetes or OpenShift clusters, you need to install an agent. As result you’ll see the following pods.
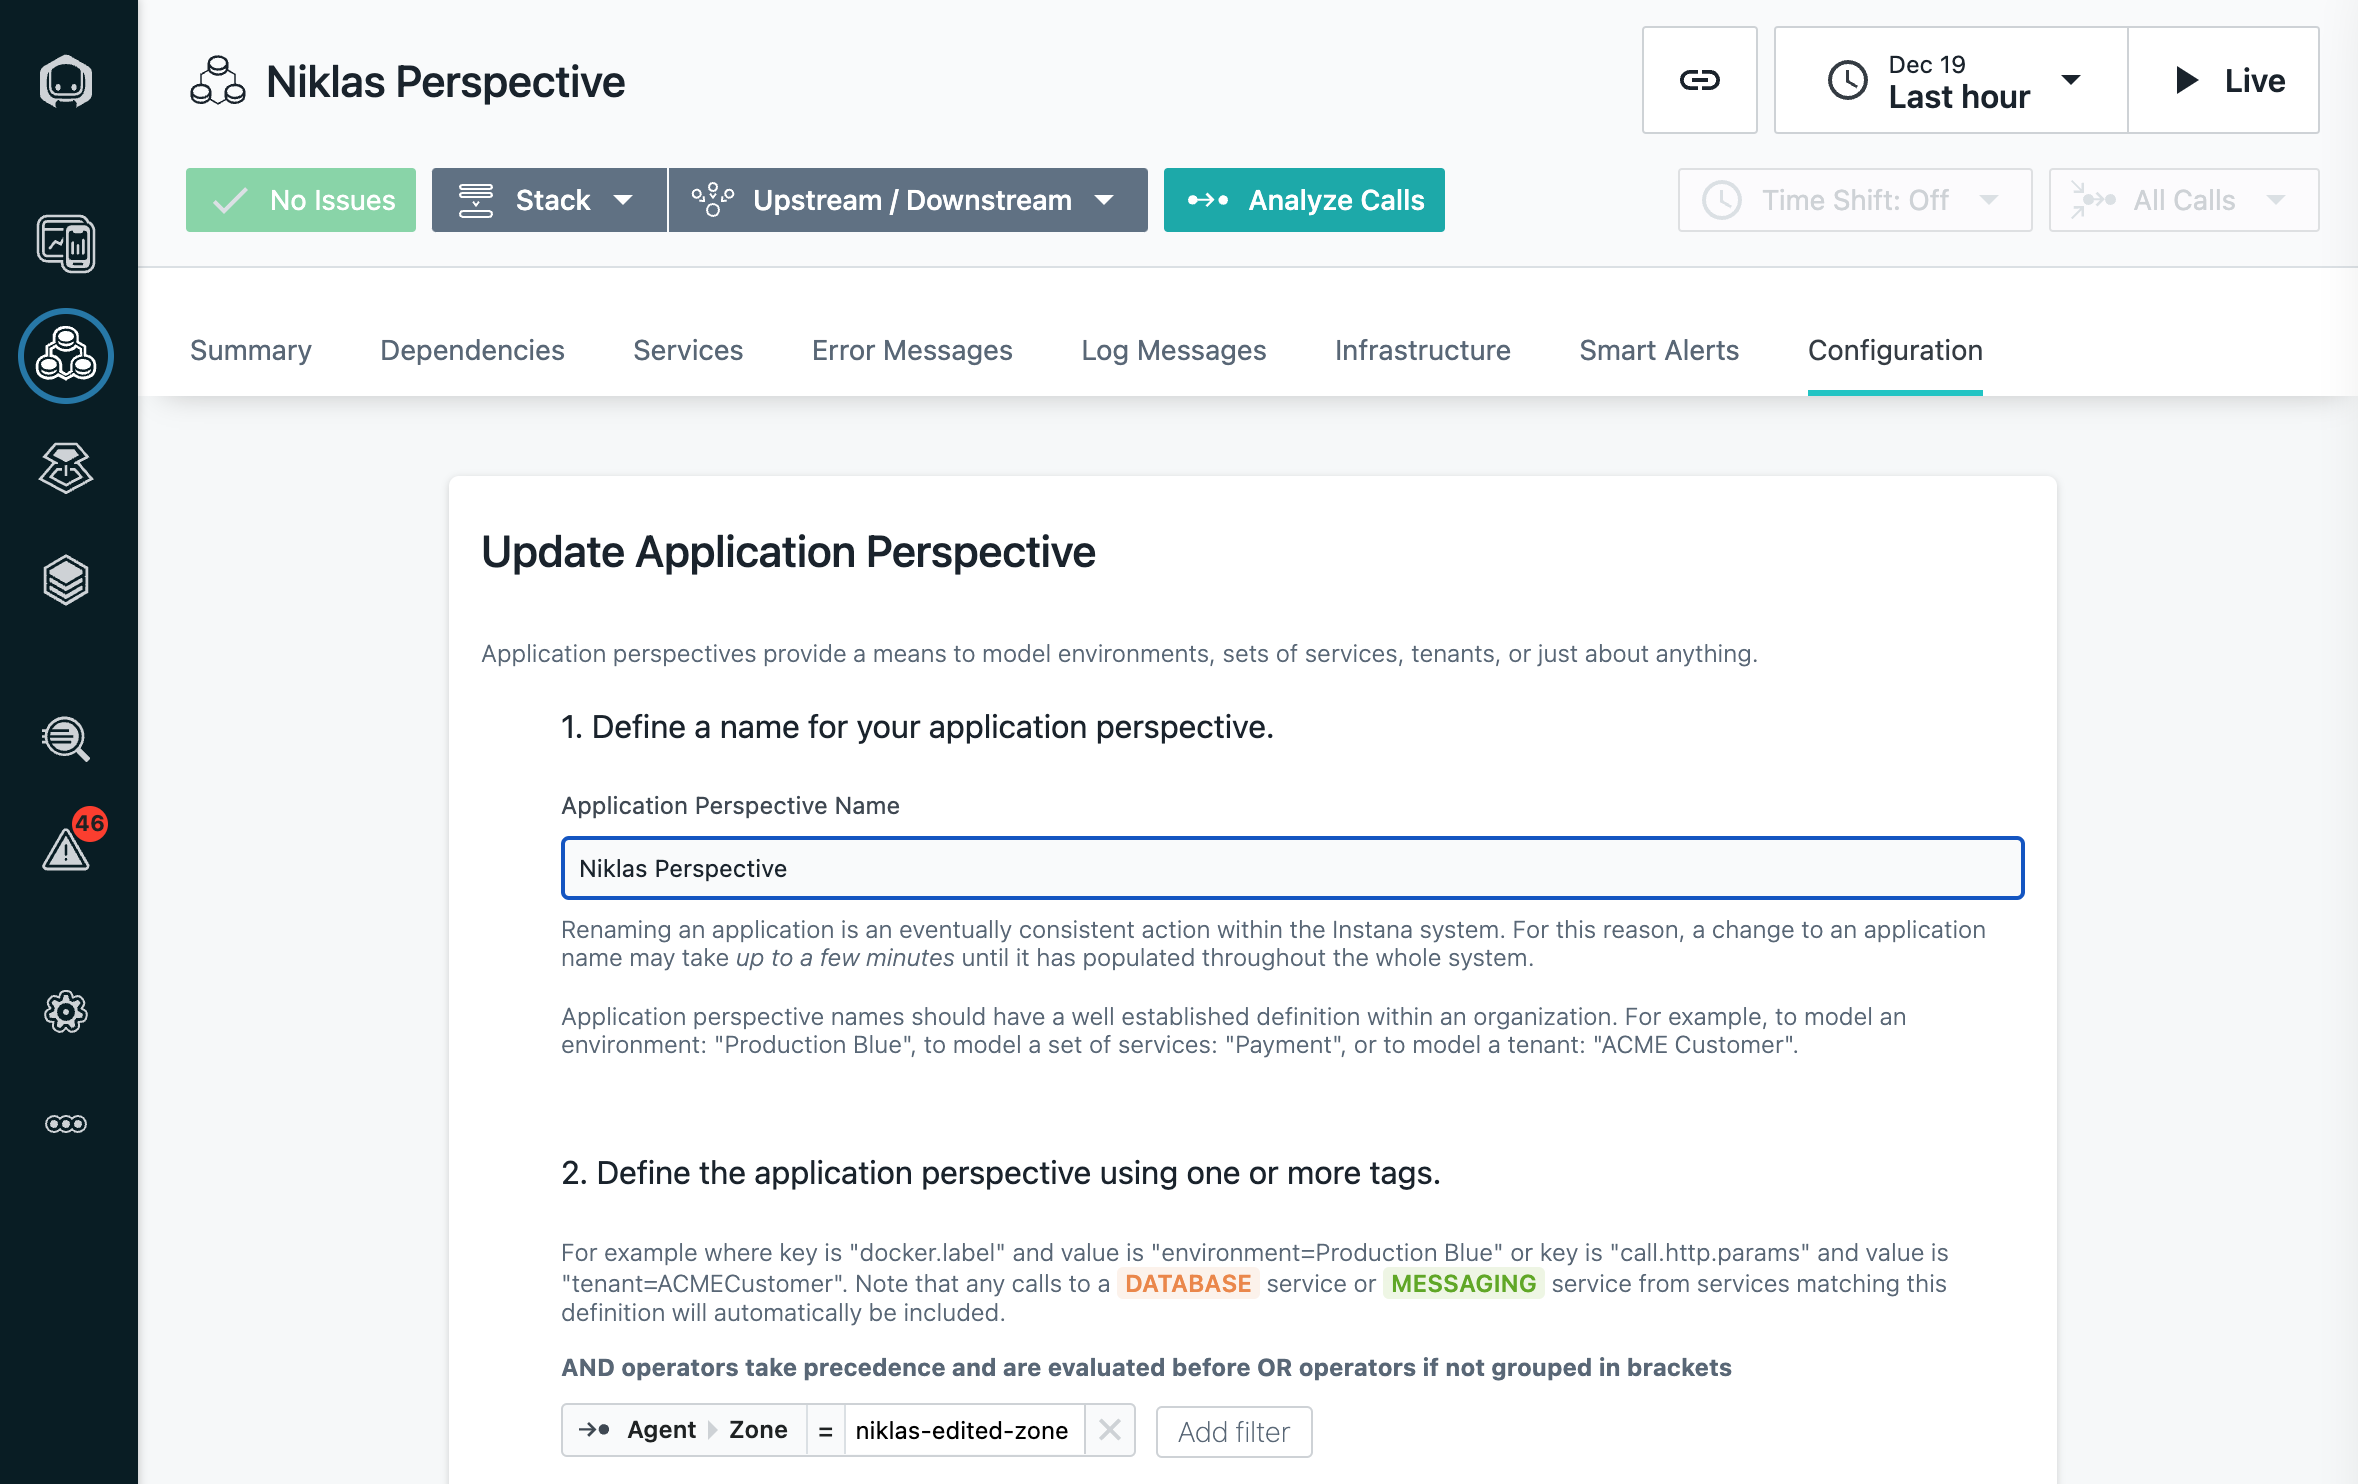
In the Instana dashboard you need to define an application perspective to only display entries from your own zone which is an OpenShift cluster in this case.
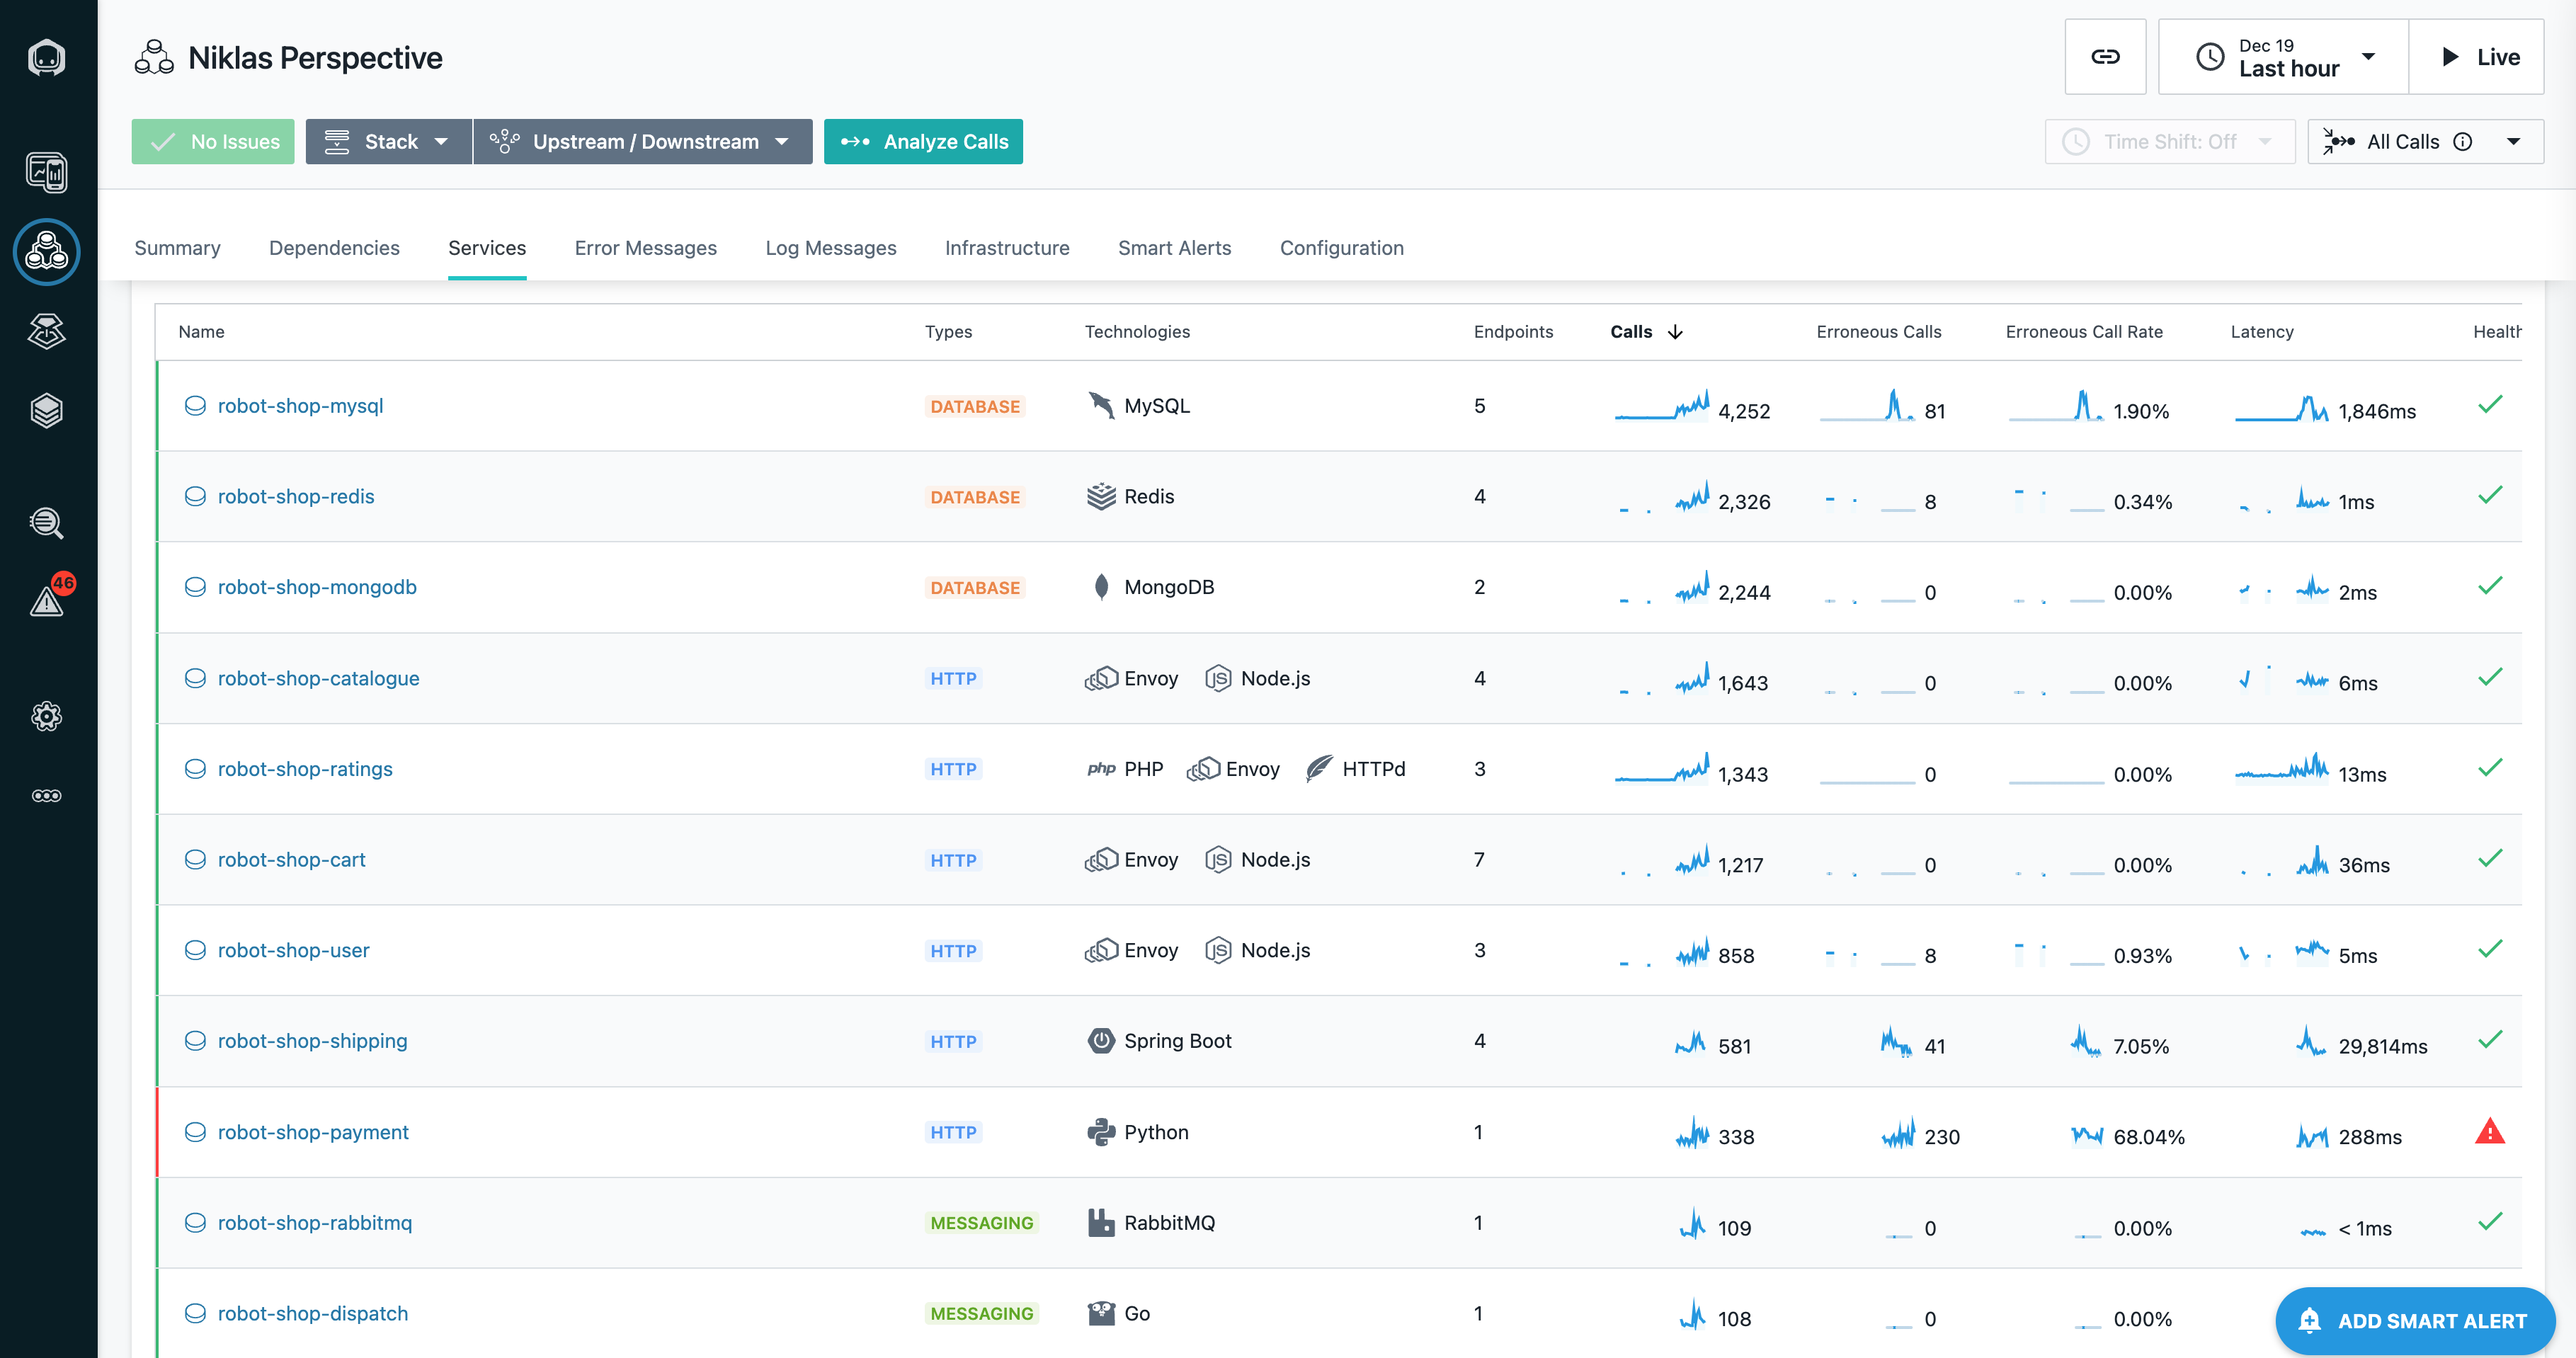
There is an example cloud-native application which comes with several services which you’ll find in your application perspective.
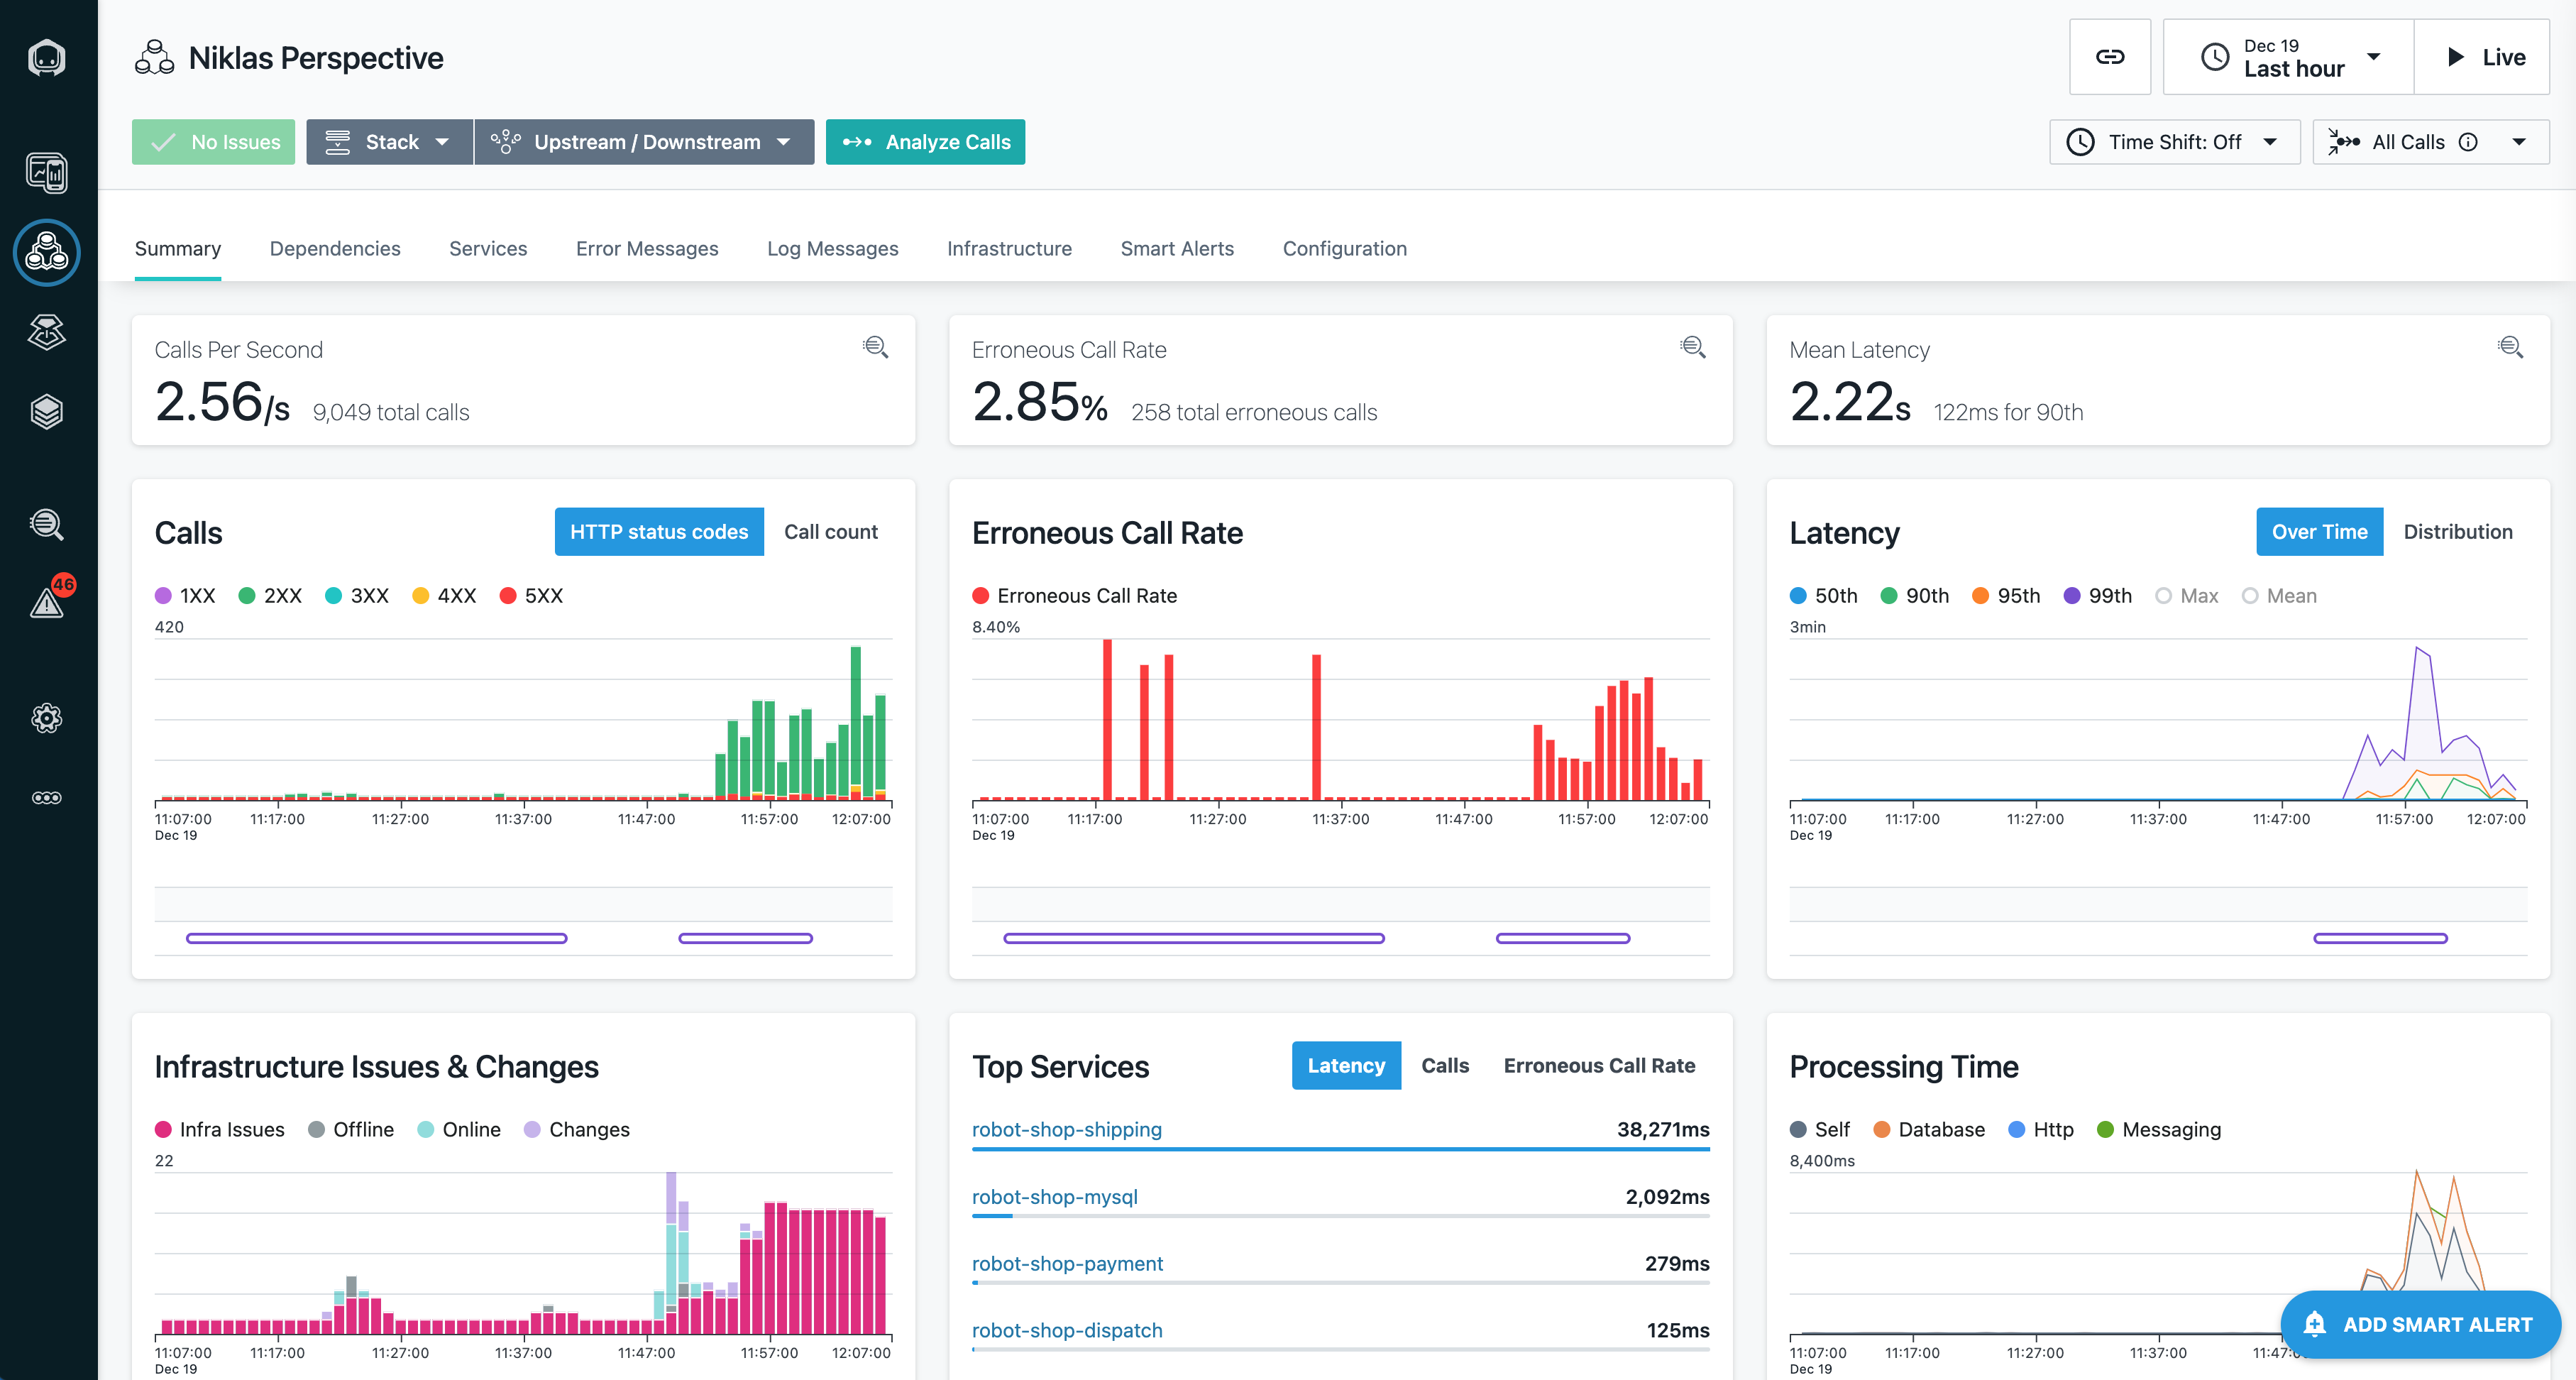
As part of the sample application a container is provided that creates load so that real application performance can be displayed in the Instana dashboard, for example endpoint invocations, latency and much more.
To learn more about Instana, check out the Instana landing page.


