
Developers need to do more than writing code. The understanding and correct usage of DevOps, operations and observability are essential to build and run software. To efficiently operate applications, IBM provides an observability tool called Instana which provides specific functionality to observe Java applications via OpenTelemetry.
What is IBM Instana Observability?
Boost functionality and observability in your enterprise application performance monitoring (APM) with IBM Instana. Improve application performance management and accelerate CI/CD pipelines no matter where applications reside — public cloud, private cloud, hybrid cloud, on premises, IBM Z and more. With IBM Instana Observability, users can combine APM with automation capabilities and distributed tracing to deploy on premise or as a SaaS solution.
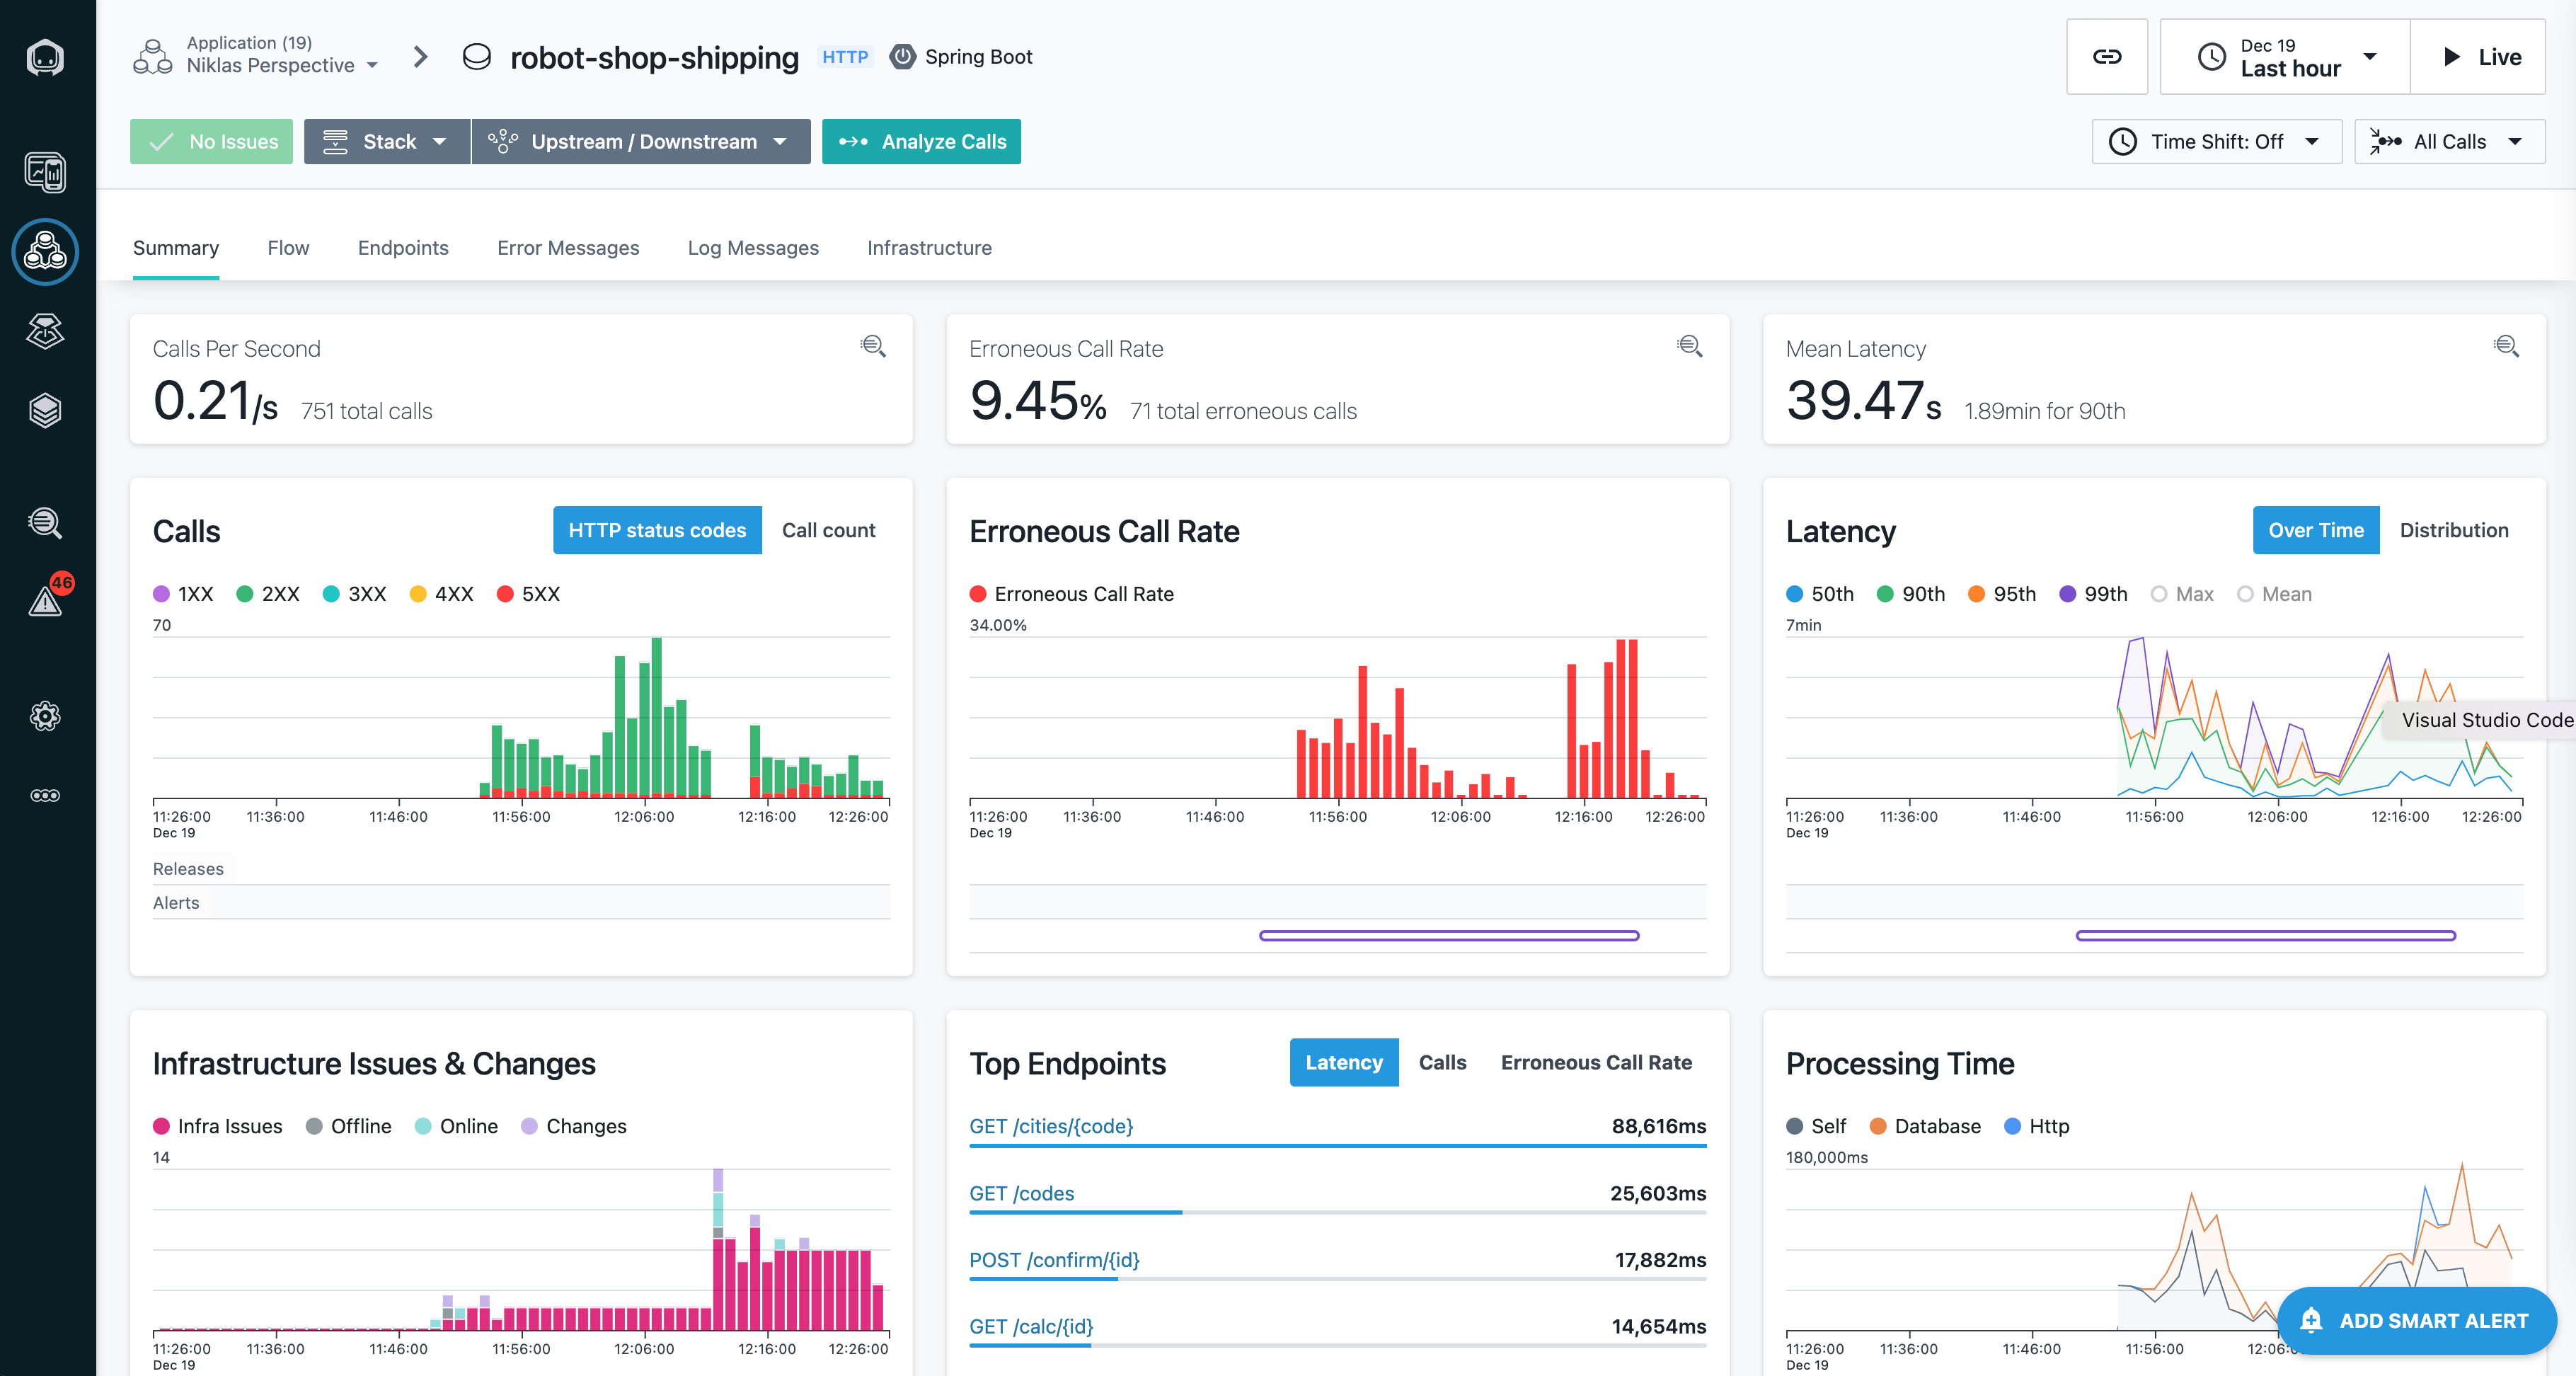
There is a sample cloud native application including a load generator. Once installed you can observe the sample robot application via the Instana dashboard.
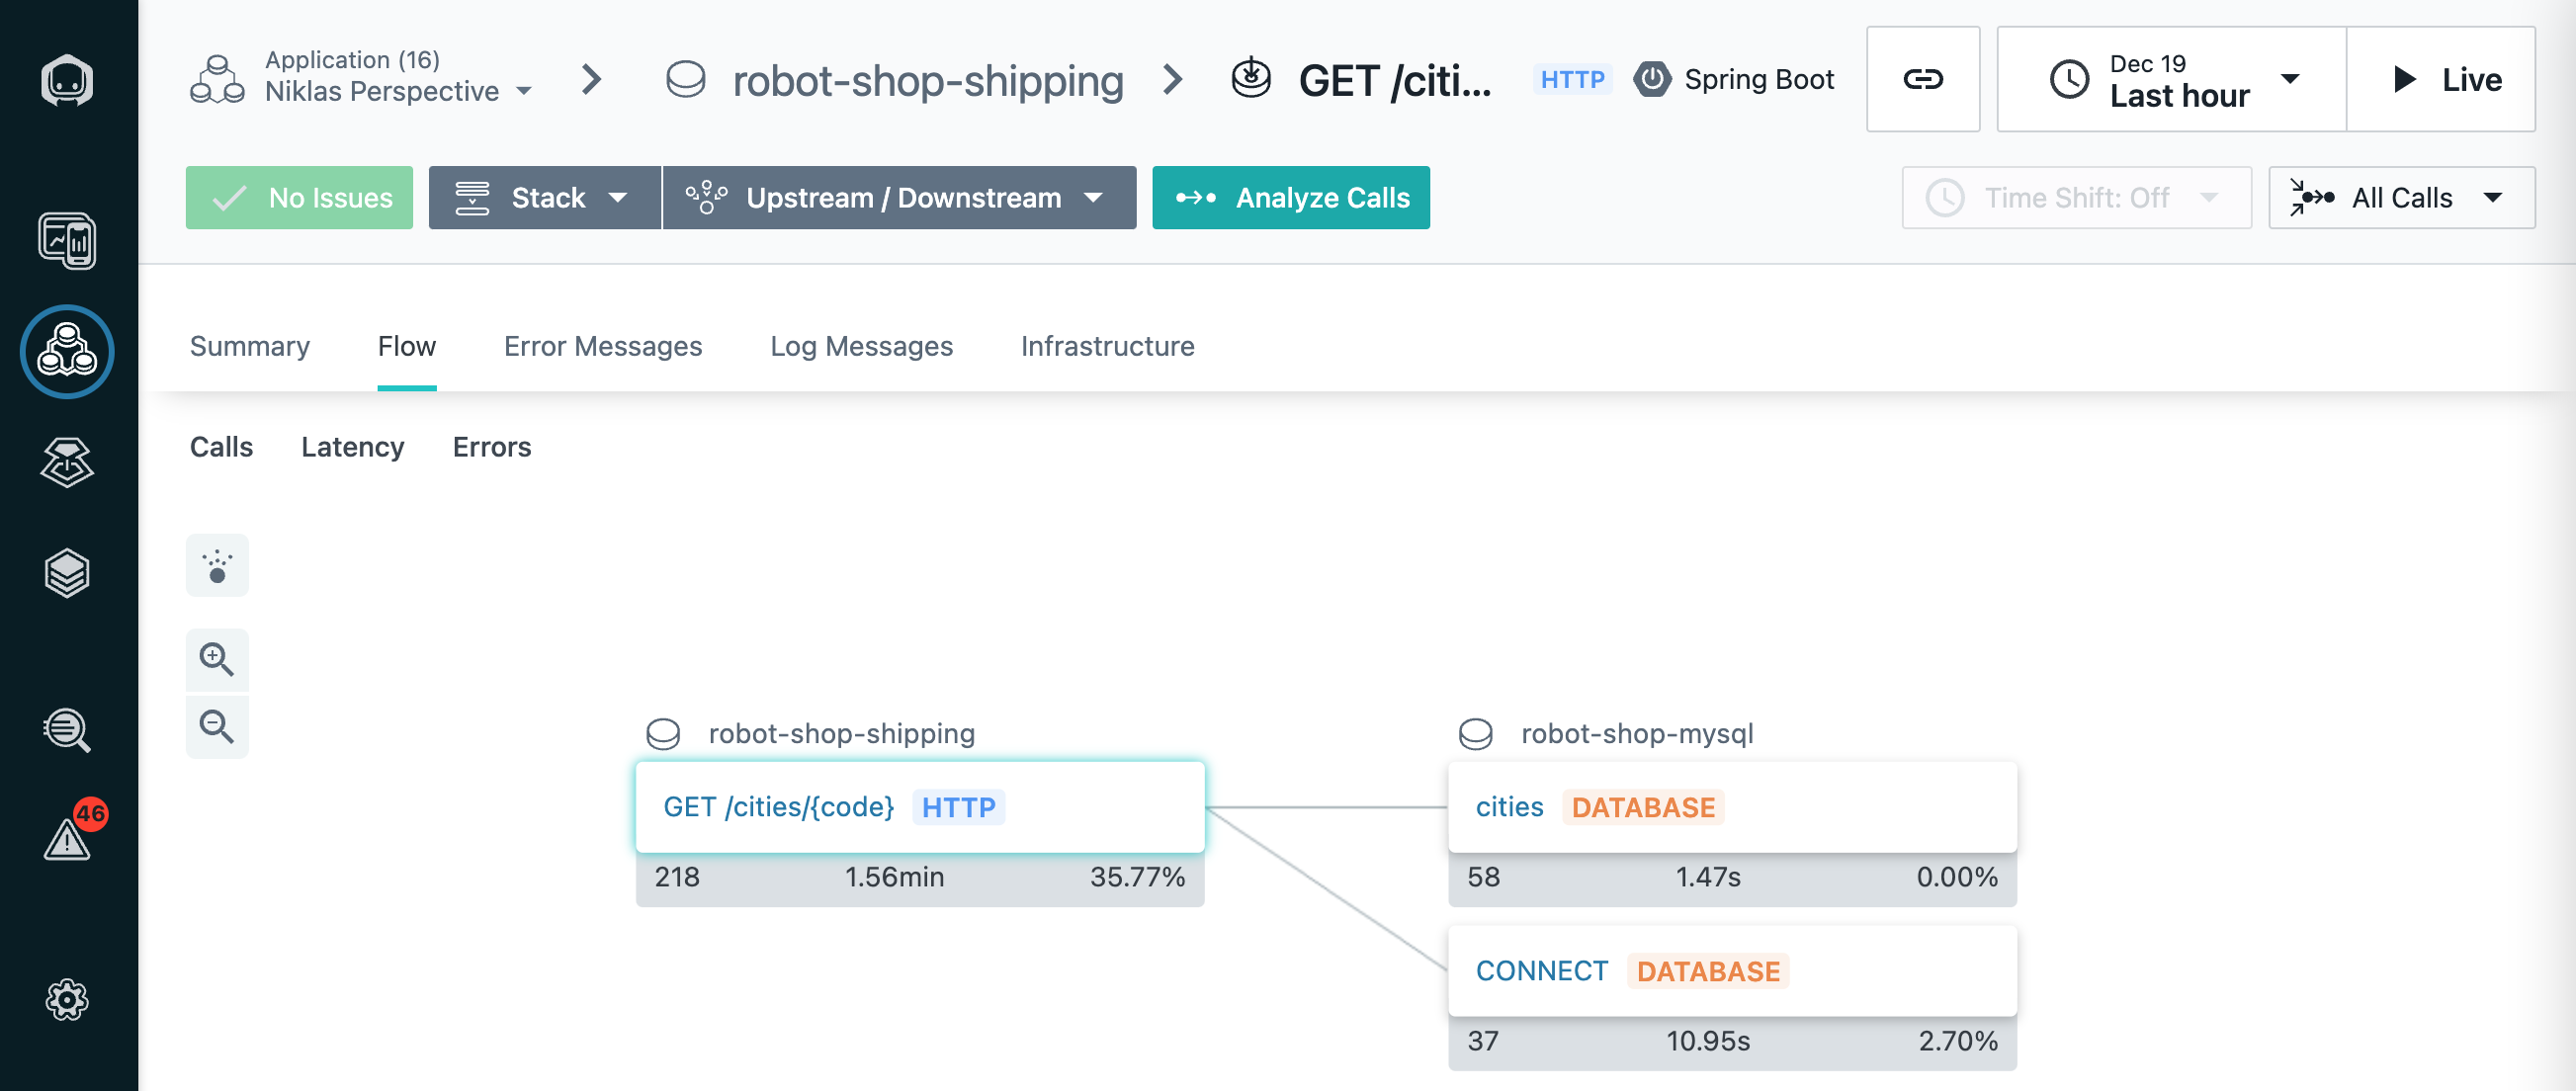
One feature that I like is similar to what Kiali provides. You can see the chain of invocations for endpoints via the industry standard OpenTelemetry.
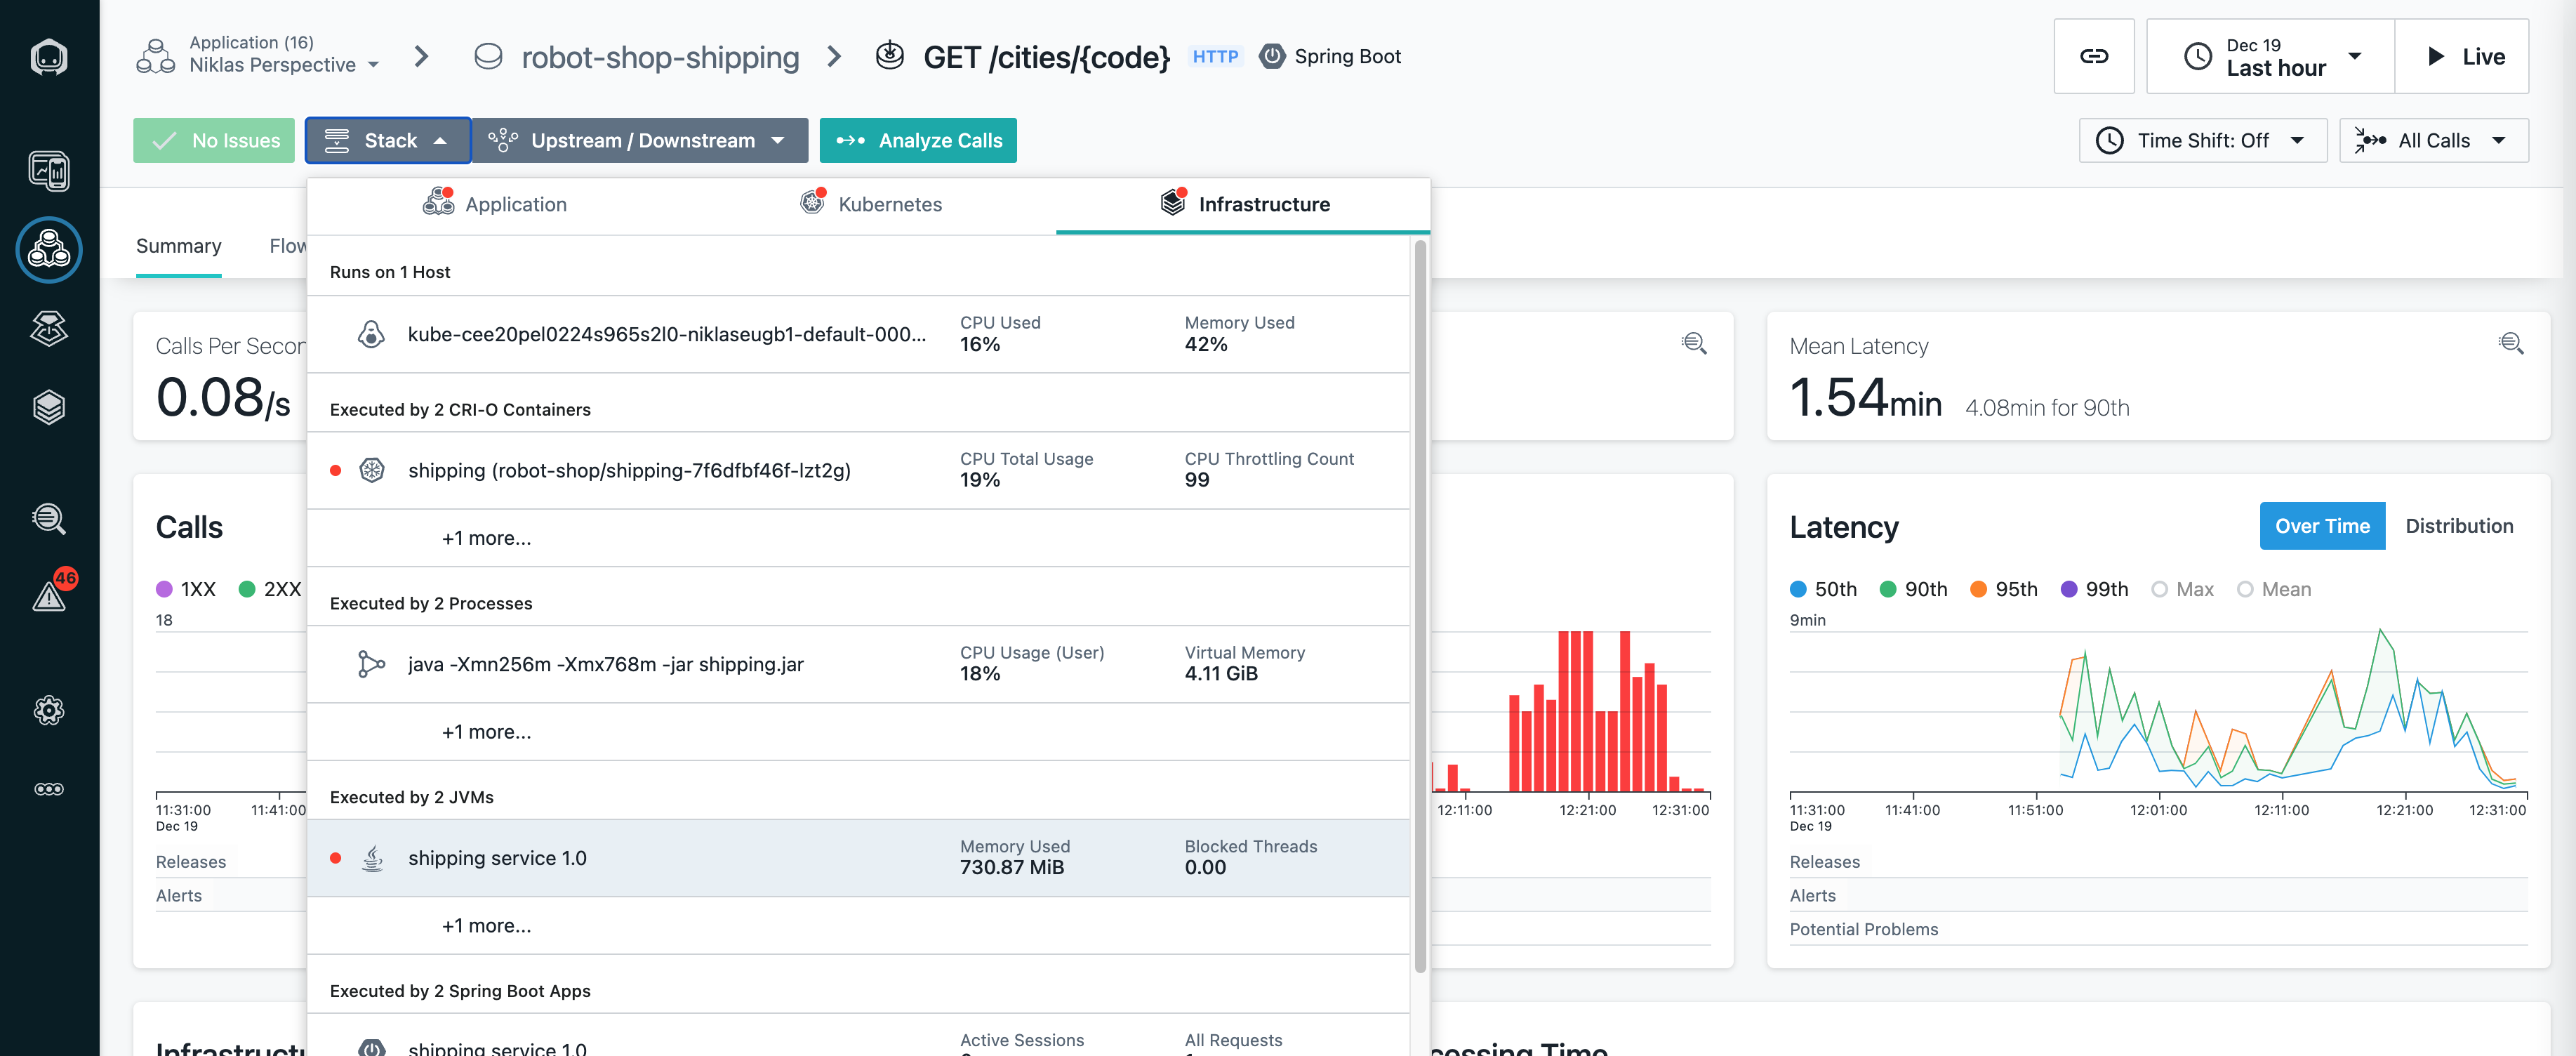
Since most enterprise applications have been implemented with Java, Instana provides specific functionality for Java services. For example under the ‘Stack’ tab you see JVMs.
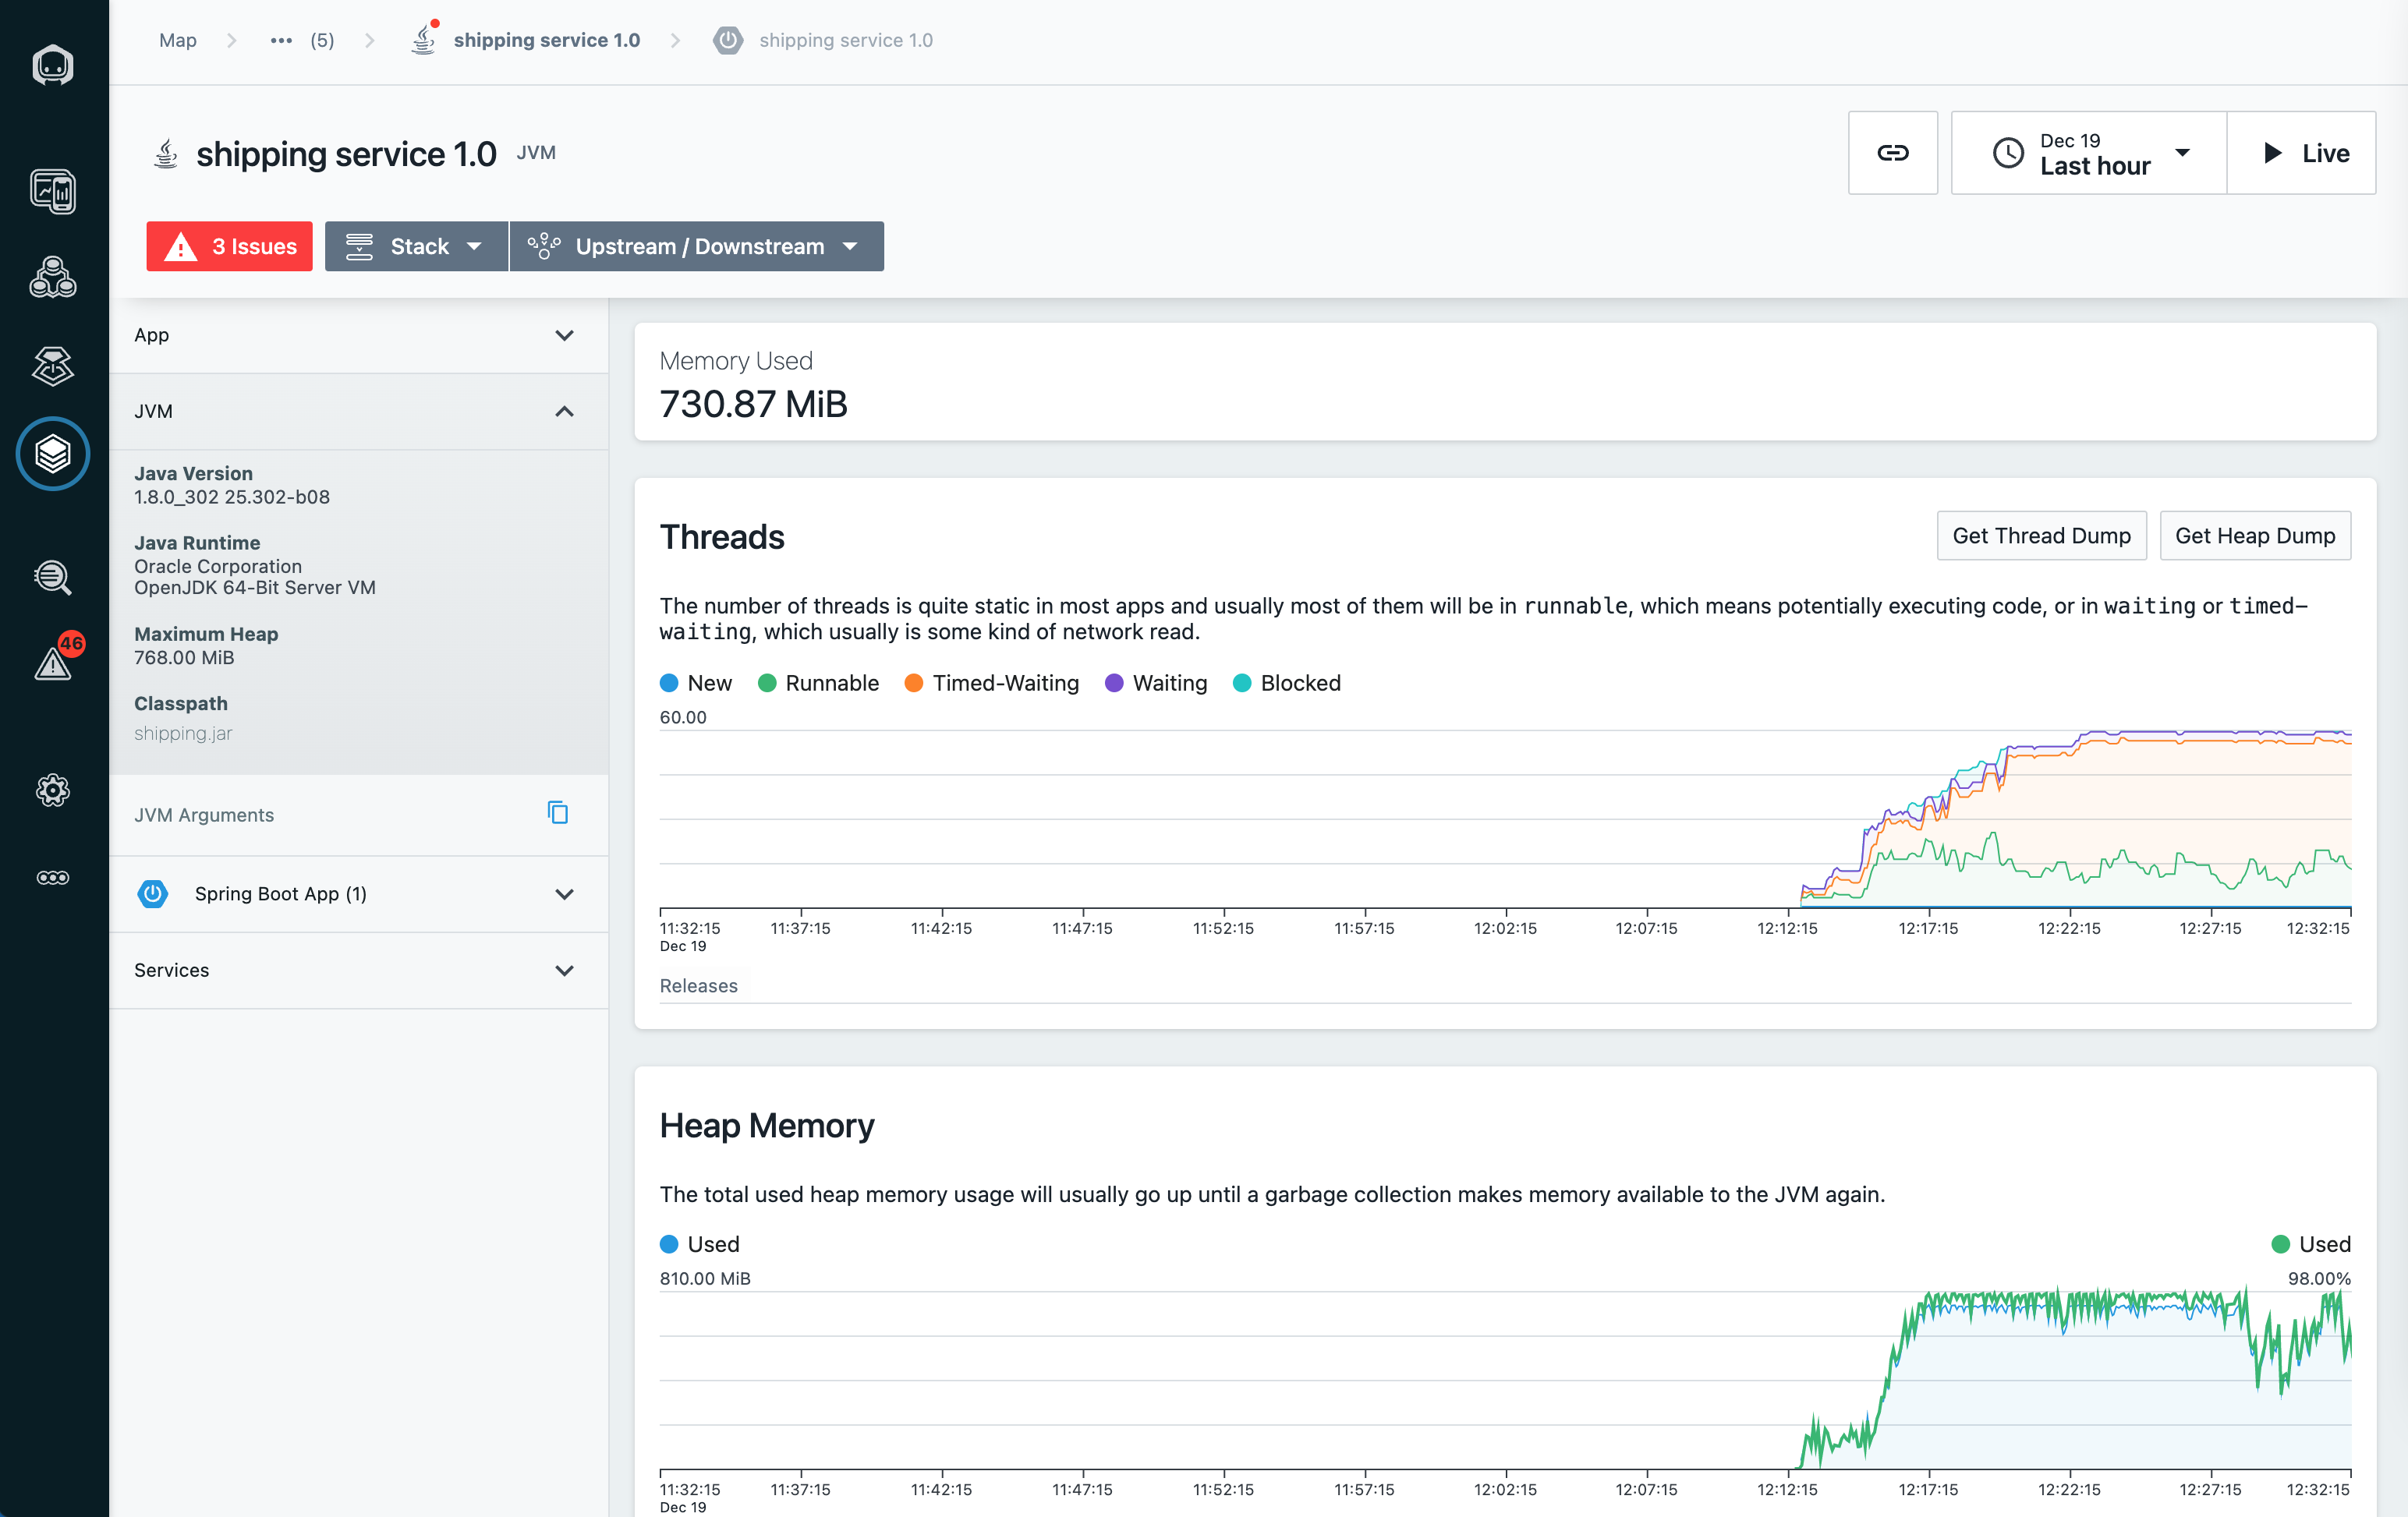
When clicking on the JVM entries, you can get information about threads, heap memory and more. When Java errors occur, Instana even shows where they occurred by de-compiling the Java code and pointing you to the specific line of code.
To learn more about Instana, check out the Instana landing page.
I’ve also written two more posts about Instana: