Operators automate day 2 operations for Kubernetes based software. Operators need to know the state of their operands. One way to find out the state is to check metrics information stored in Prometheus. This article describes how to export metrics from applications running on Kubernetes to make them accessible by Prometheus.
The complete source code from this article is available in the ibm/operator-sample-go repo. The repo includes operator samples that demonstrate patterns and best practises.
Let’s look how Prometheus can be deployed on Kubernetes and how Go and Java based applications can export metrics so that Prometheus is able to read and store it.
1. Setup of Prometheus
An easy way to install Prometheus is to utilize the Prometheus operator. Before it can be installed, the Operator Lifecycle Manager (OLM) needs to be deployed. When you develop operators with the Operator SDK, it is possible to deploy OLM with just one command:
1
2
3
$ operator-sdk olm install
or
$ curl -sL https://github.com/operator-framework/operator-lifecycle-manager/releases/download/v0.20.0/install.sh | bash -s v0.20.0
Next the Prometheus operator can be installed.
1
$ kubectl create -f https://operatorhub.io/install/prometheus.yaml
2. Configuration of Prometheus
To set up the actual Prometheus instance on Kubernetes, RBAC access rights need to be defined. Read the documentation for details. In summary the following four files handle the minimal setup.
3. Linkage between Prometheus and custom Applications
Applications can export data in the format Prometheus expects. The applications don’t push this data, but they provide endpoints that Prometheus pulls on a scheduled basis. To tell Prometheus these endpoints, the custom resource ‘ServiceMonitor’ is used.
Here is a simple sample. The trick is the correct usage of labels and selectors. The selector in the service monitor finds the appropriate service. The selector in the service links to pods.
1
2
3
4
5
6
7
8
9
10
11
12
13
apiVersion: monitoring.coreos.com/v1
kind: ServiceMonitor
metadata:
  labels:
    app: myapplication
  name: myapplication-metrics-monitor
  namespace: application-beta
spec:
  endpoints:
    - path: /q/metrics
  selector:
    matchLabels:
      app: myapplication
When building operators with the Operator SDK, the SDK creates this service monitor automatically. All you need to do is to uncomment one line.
4. Writing Metrics
There are several libraries and frameworks for different languages available. Here is a sample how to write metrics from a Golang application.
1
2
3
4
5
6
7
8
9
10
11
12
import (
  "github.com/prometheus/client_golang/prometheus"
)
var countReconcileLaunched = prometheus.NewCounter(
  prometheus.CounterOpts{
    Name: "reconcile_launched_total",
    Help: "reconcile_launched_total",
  },
)
func (reconciler *ApplicationReconciler) Reconcile(ctx context.Context, req ctrl.Request) (ctrl.Result, error) {
  countReconcileLaunched.Inc()
  ...
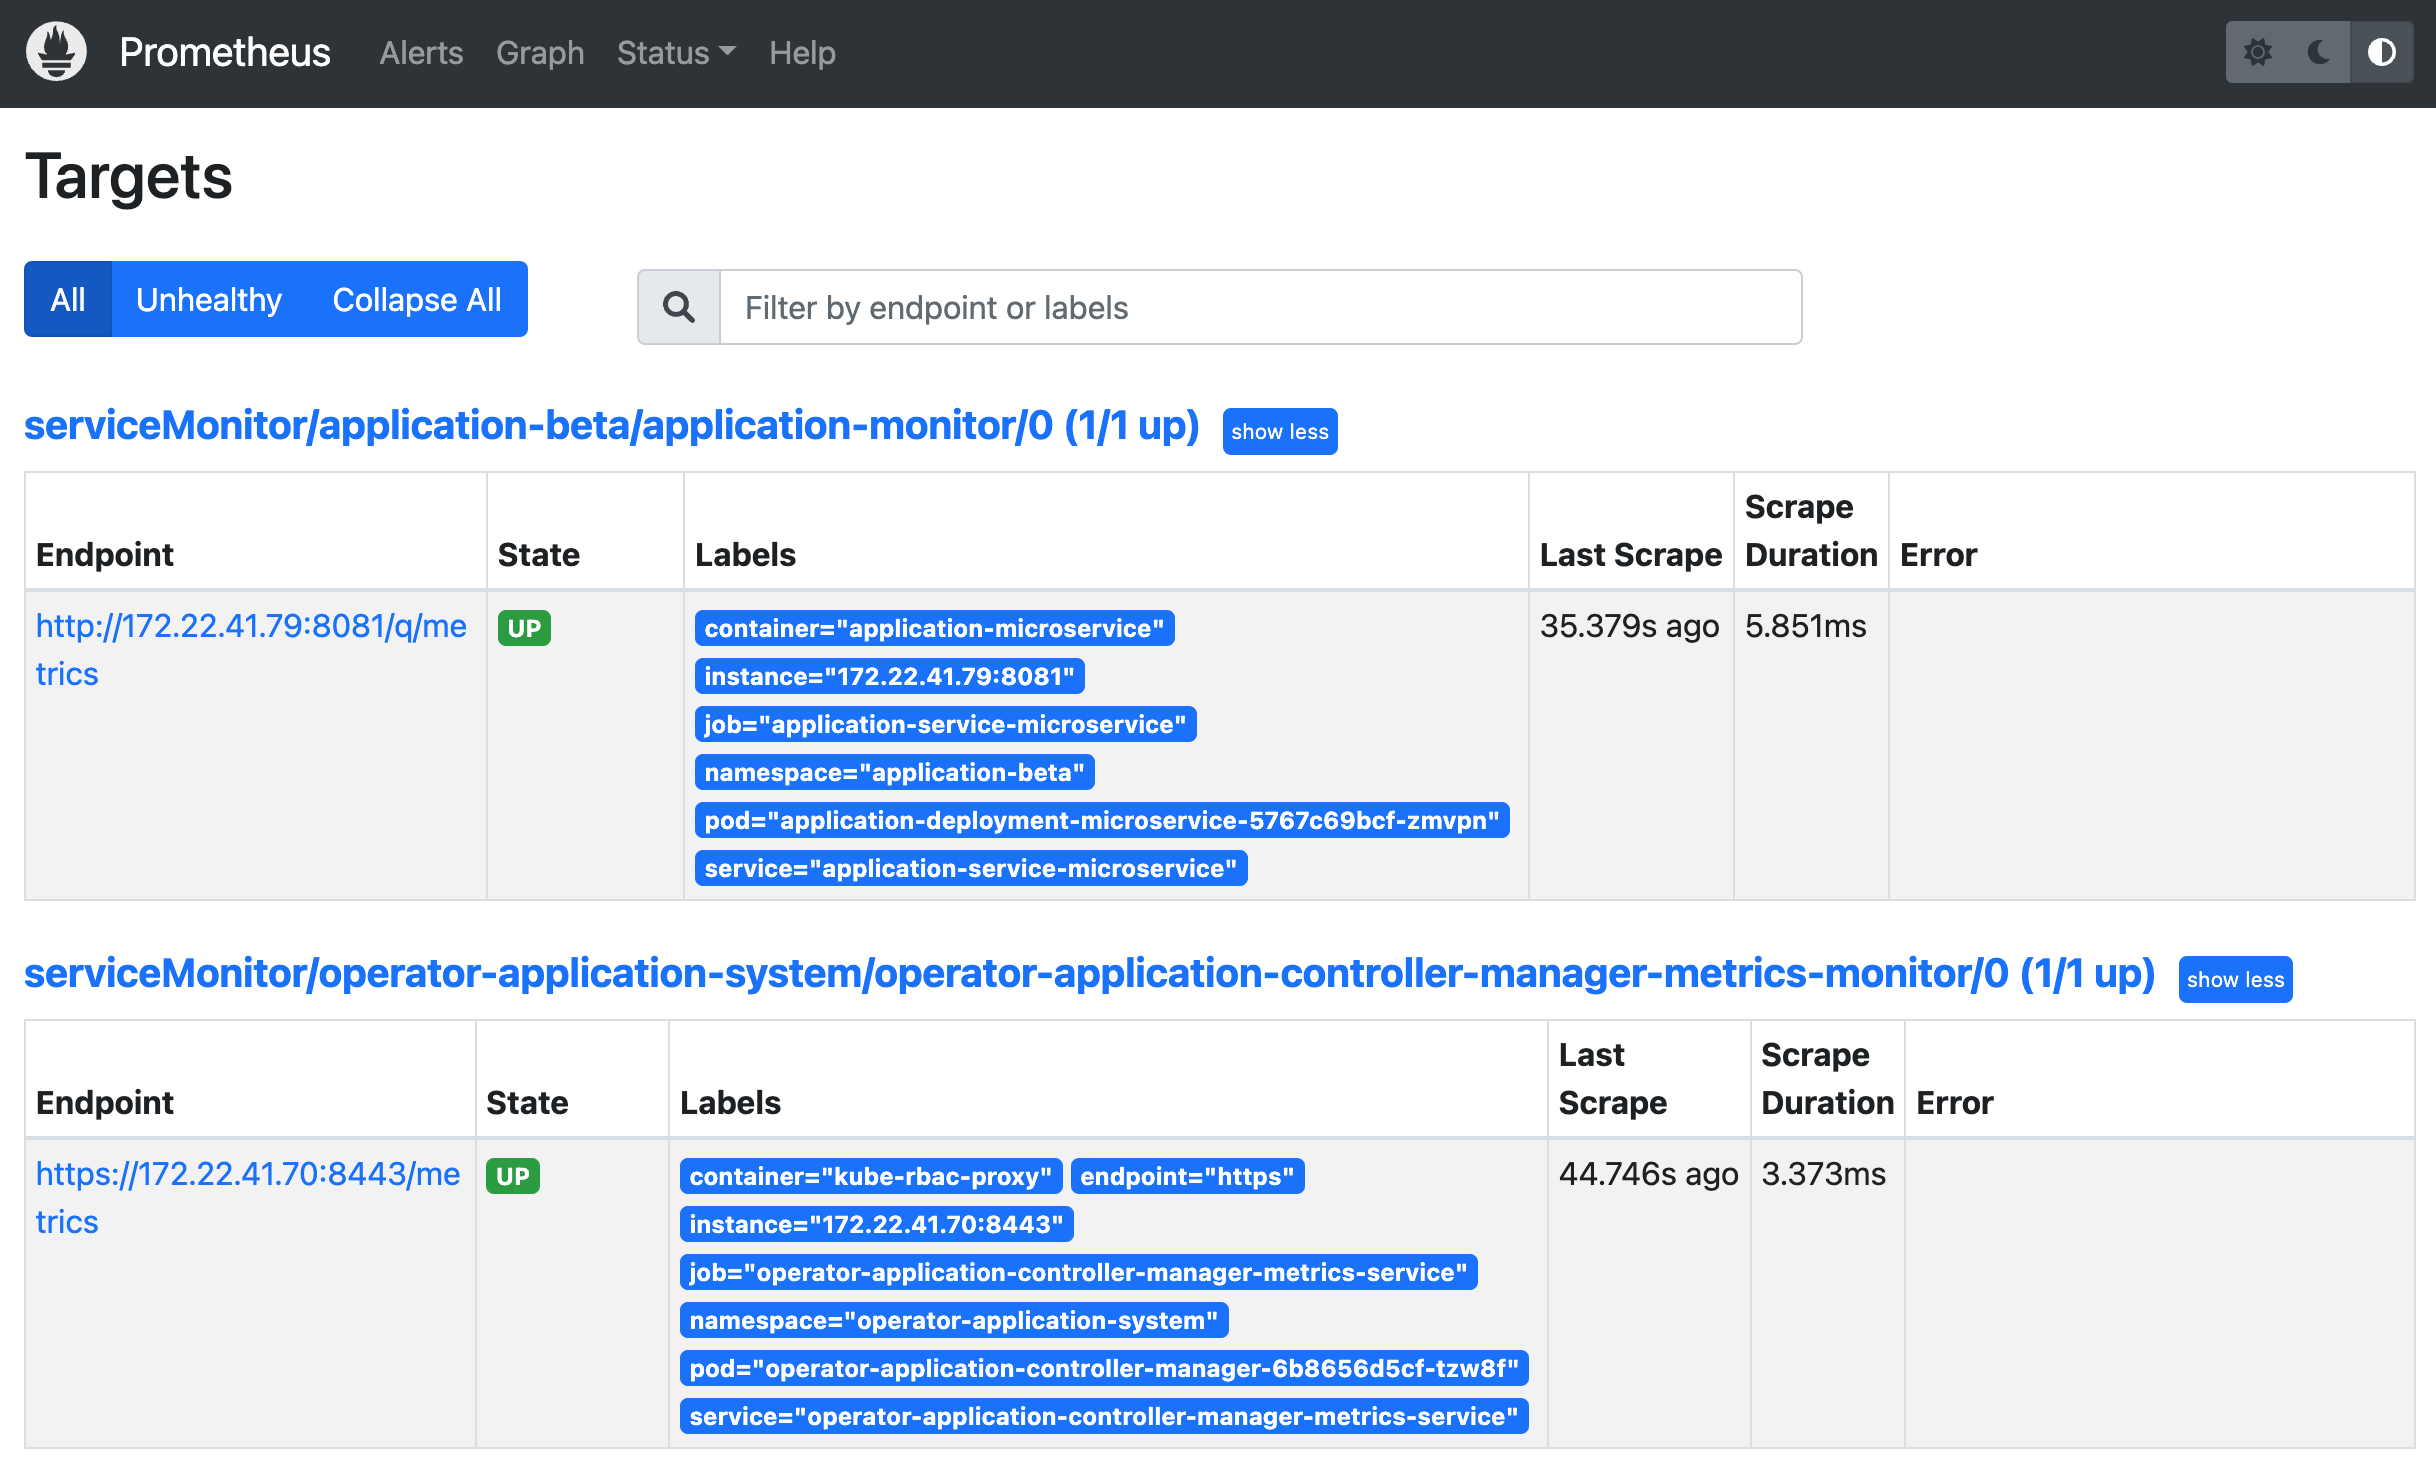
To learn more about operator patterns and best practices, check out the repo operator-sample-go. The repo shows how to export metrics from a Quarkus application and a Go based operator. The screenshot shows the two registered service monitors.
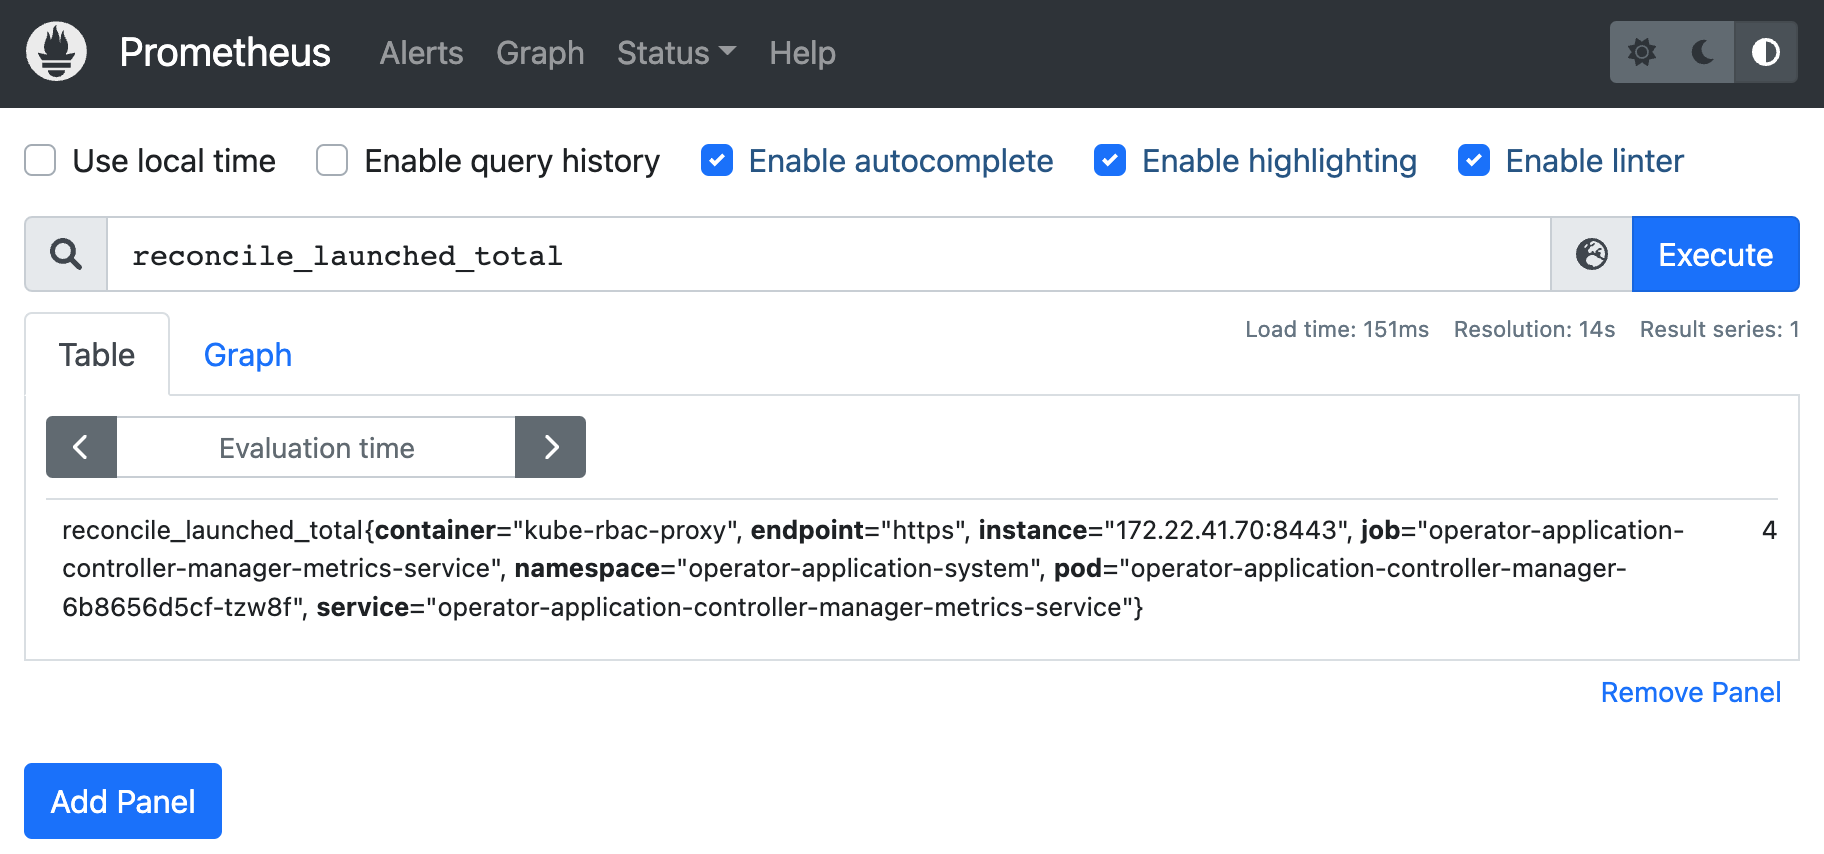
Finally the data can be queried, for example in the Prometheus user interface.


