
IBM Bluemix provides a service Predictive Analytics which developers and data scientists can use to build applications that help users to make predictions about the future for different scenarios. Below is a quick introduction of this functionality.
Let’s start with a definition of Predictive Analytics from Wikipedia.
Predictive analytics encompasses a variety of statistical techniques from predictive modeling, machine learning, and data mining that analyze current and historical facts to make predictions about future or otherwise unknown events.
In order to develop applications that provide predictive analytics functionality, developers work closely together with data scientists. Data scientists build models and developers build applications that run queries against the models. For data scientists IBM provides the predictive analytics platform SPSS Modeler. Models can be deployed to the Predictive Analytics service on Bluemix. Developers can use the REST APIs of this service to run queries against models and deploy their applications on Bluemix.
Modeling via the SPSS Modeler Tool
The SPSS Modeler is a rich client application that is available for Windows and MacOS. In order to try it, a 30 days trial is provided.
The SPSS Modeler comes with a couple of tutorials and sample data. Below is a quick overview of a simple scenario. Read the tutorial for more details.
The bank maintains a database of historical information on customers who have taken out loans with the bank, including whether or not they repaid the loans (Credit rating = Good) or defaulted (Credit rating = Bad). Using this existing data, the bank wants to build a model that will enable them to predict how likely future loan applicants are to default on the loan.
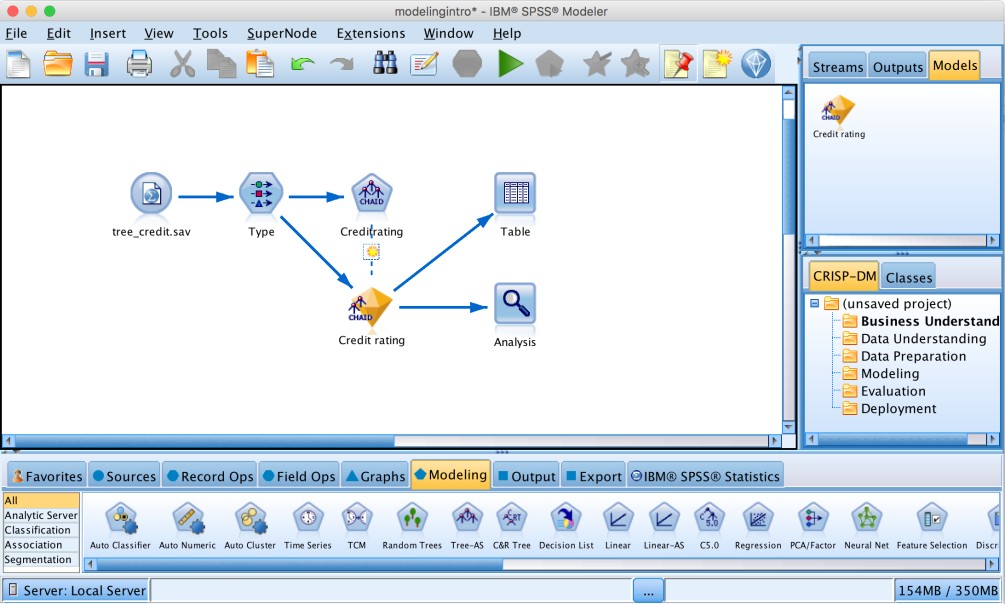
Here is a screenshot of the SPSS Modeler with the finished stream that generates the model. The first node reads data from a file. In the second node data types are defined. The ‘creditrating’ node defines how to generate the model. The yellow model represents the generated model. The table and analytics nodes describes the results.
In the type node the fields and types are defined as well as whether a field is an input field or the target field. In this case the credit rating is the target field.
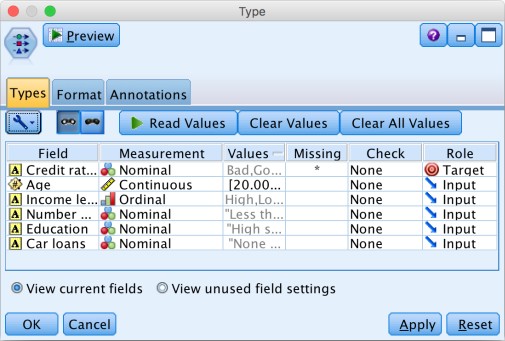
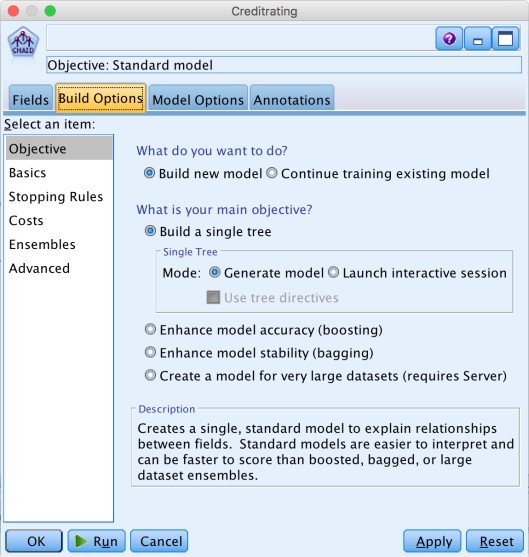
In this sample a classification method is used that builds decision trees.
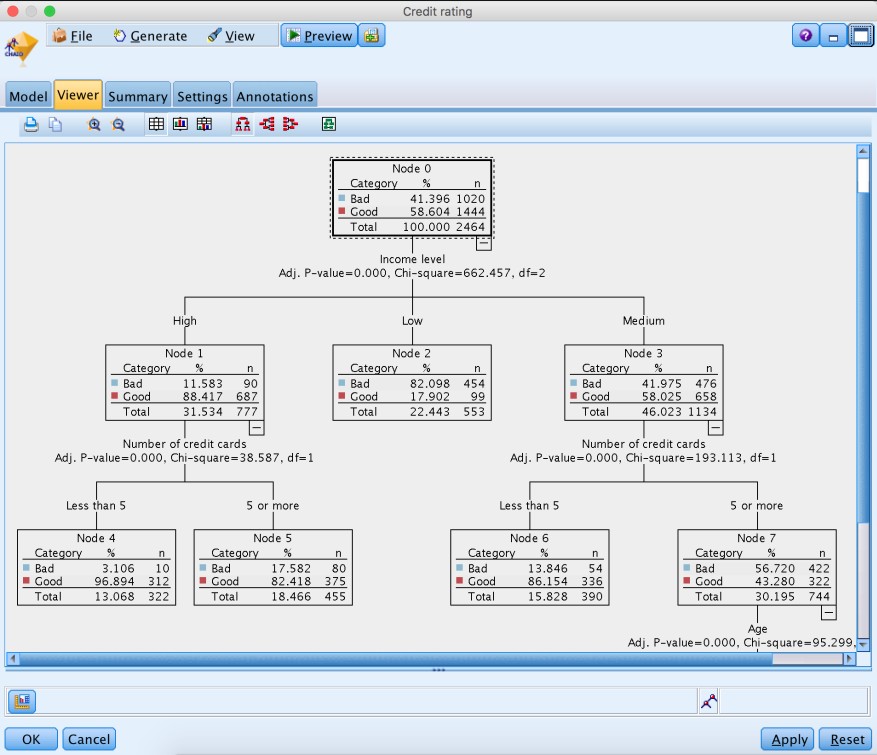
The generated model shows the generated decision tree. As the next screenshot shows the credit rating depends primarily on the income and then the number of credit cards.
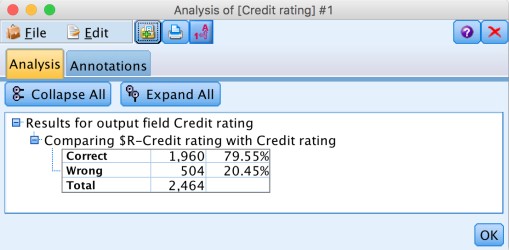
The analysis node shows an accuracy of 79.55%. Note that for a better analysis typically the data is divided into training and evaluation.
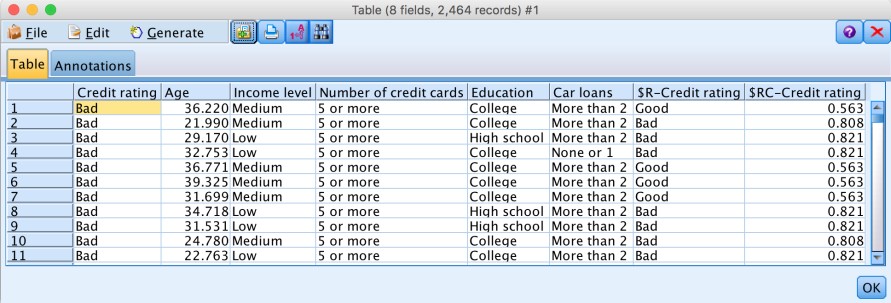
The table node shows both the original data with the actual credit rating as well as two additional columns with the estimated rating and confidence.
Developing Applications with Predictive Analytics Functionality
The models that have been produced by data scientists via the SPSS Modeler can be deployed to the Predictive Analytics service on Bluemix. You can either use the dashboard or APIs.
The following scenario is another sample that comes with the Predictive Analytics service. Read the Drug Treatments tutorial for more details.
Imagine that you are a medical researcher compiling data for a study. You have collected data about a set of patients, all of whom suffered from the same illness. During their course of treatment, each patient responded to one of five medications. Part of your job is to use data mining to find out which drug might be appropriate for a future patient with the same illness.
Here is the stream that generates the model. In order to run queries against the model from applications the ‘scoreInput’ node and the table node are used.
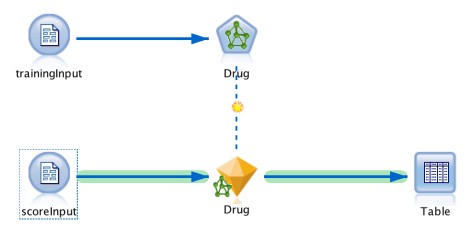
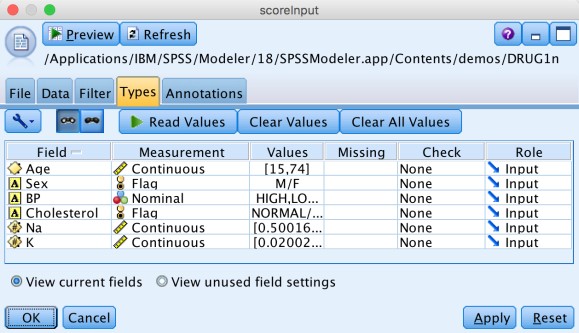
The ‘scoreInput’ node defines the input data of a query.
Here is a sample POST request.
1
2
POST http://nik-pa.mybluemix.net/score
{"context":"drug1N","input":{"tablename":"scoreInput","header":["Age","Sex","BP","Cholesterol","Na","K"],"data":[["35","M","NORMAL","NORMAL","0.697","0.056"]]}}
The table node defines the output data of a query.

This is the response to the sample request above.
1
[{"header":["Age","Sex","BP","Cholesterol","Na","K","$N-Drug","$NC-Drug"],"data":[[35,"M","NORMAL","NORMAL",0.697,0.056,"drugX",0.9999482075987031]]}]