Update November 2016: The Embeddable Reporting service has been deprecated and replaced with an IBM partner solution.
Here is a quick introduction to another powerful service in IBM Bluemix – Embeddable Reporting (beta). With this service developers can easily build reports using a graphical tool (or API) to visualize data and embed the reports either as HTML or JSON in their web applications.
There are two good tutorials describing the service – Leverage IBM Cognos on IBM Bluemix using the Embeddable Reporting service and Embed rich reports in your applications. I’ve tried the sample that is documented in the Bluemix documentation. Below is a quick summary of the key concepts.
To get started you need two database services in your Bluemix app. The report artifacts are stored in either Cloudant or Mongo. The data that you want to visualize needs to reside in a Bluemix DB2 database or dashDB. In order to create reports you can use either a graphical tool (Embeddable Reporting console) or APIs.
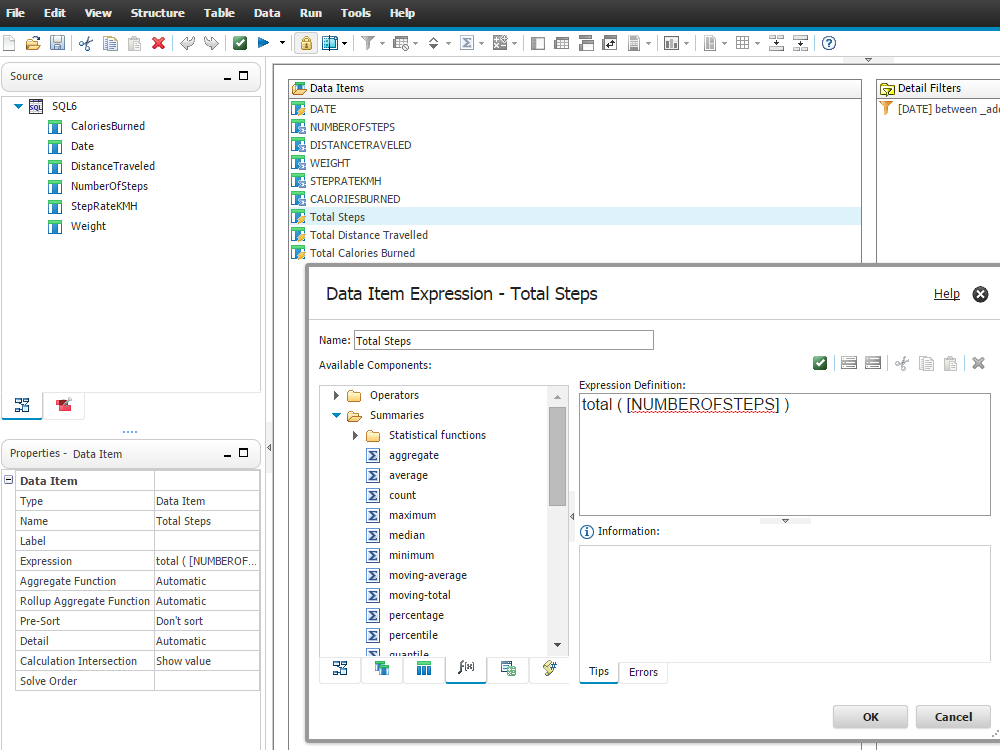
The data is read from databases via SQL.
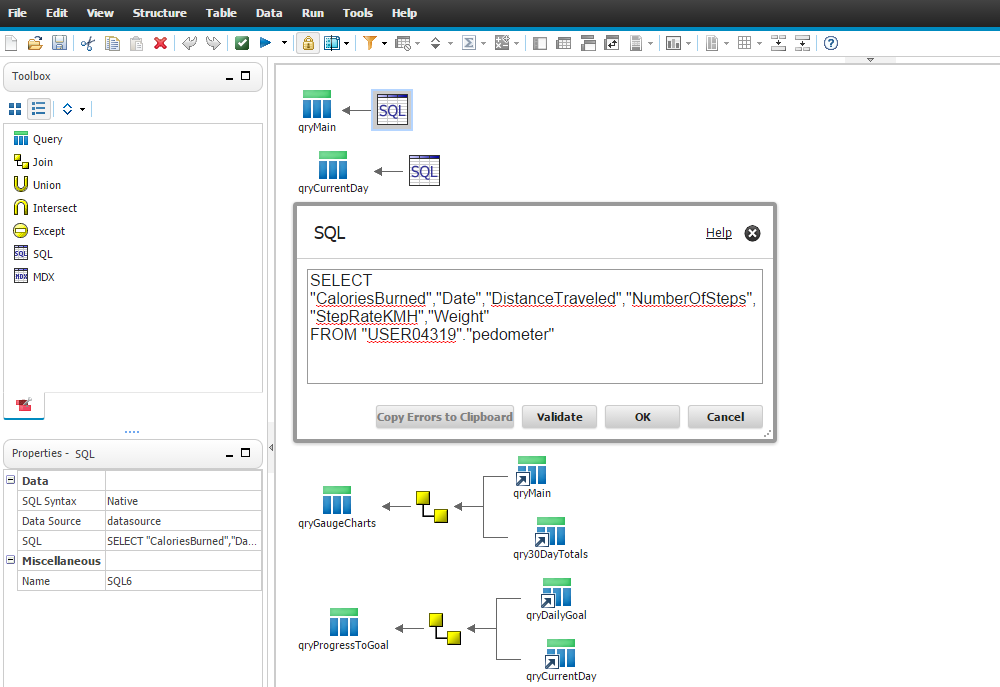
Via the graphical tool you can tweak the data, e.g. filter data, join data or add additional data items to summarize data. These changes do not require schema changes to the underlaying databases but can be done on top of this in the service.
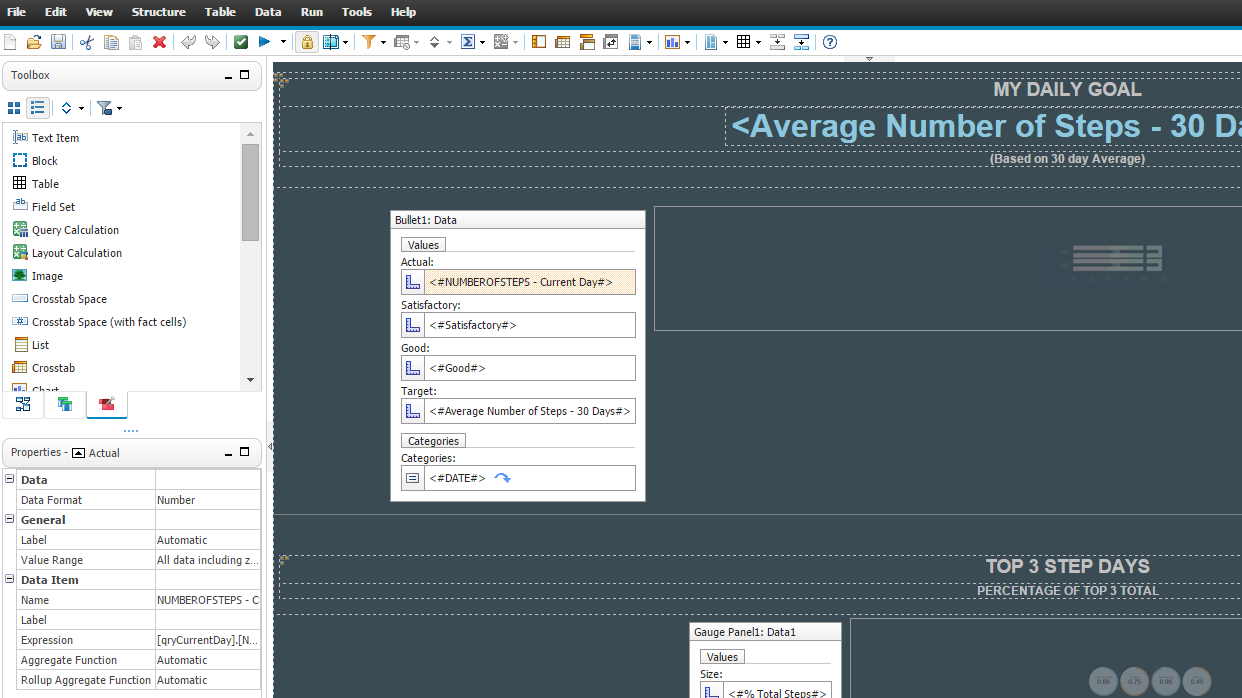
The reports are defined graphically in an HTML-like editor. The editor provides components like tables and repeat controls to define the layout as well as several charting types out of the box. Additionally you can download and import further visualization components from IBM’s AnalyticsZone. The data can easily be bound to the visual components via drag and drop or property boxes.
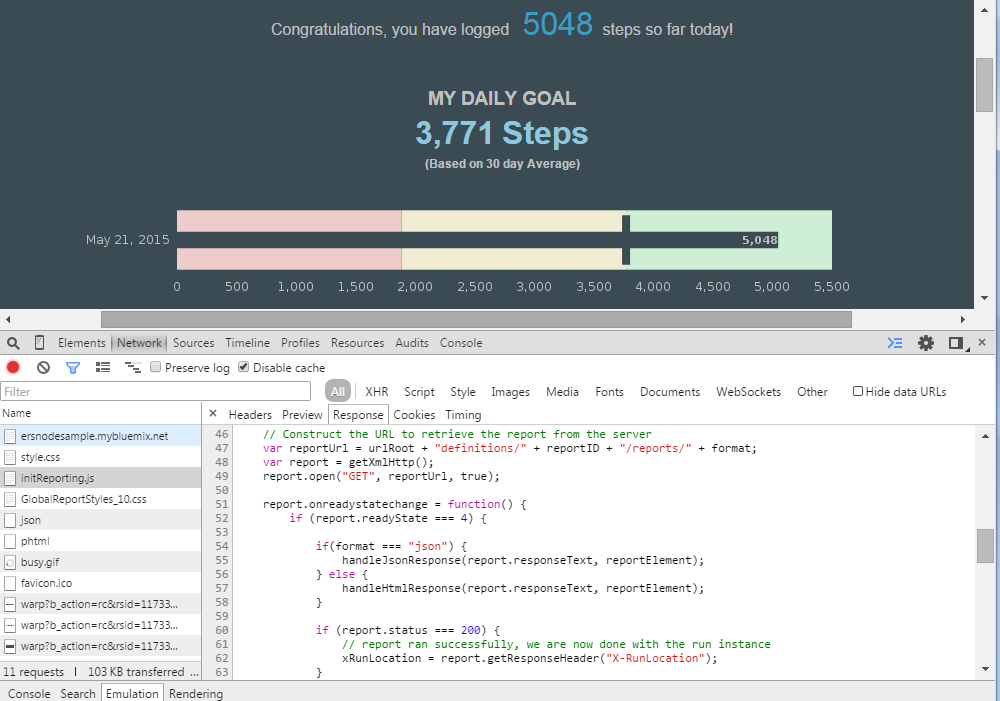
This is the resulting HTML page with data and images from the generated report.
Web applications can embed the reports by either reading the data as JSON or by reading an HTML representation of the report that can be injected into the DOM (without iframes). The HTML contains data and formatting as text and the graphical elements as images. The reports are read by the web applications via AJAX REST calls. In order to read Bluemix credentials that are necessary to access the reports server side proxies can be used.