
Recently I learned about a nice application to visualize data from sensors (and events) of your Internet of Things devices that you’ve registered with the IoT Foundation in IBM Bluemix. This can be useful to see live changes of your data and it’s also possible to see historical data. For me this is easier than navigating manually one by one through the last 10 events that are displayed in the IoT Foundation user interface and easier to read than debug nodes in Node-RED.
Read the documentation to find out more about the visualization app. The documentation currently describes that you have to build the app via Node.js locally but luckily there is a much easier way. Since the app is on GitHub you can also use the Bluemix Deploy capability to deploy the app in your Bluemix organization via one click.
Deploy the visualization app.
After this you can either enter an app key manually or just bind your IoT service to the app so that the credentials and registered devices are picked up automatically.
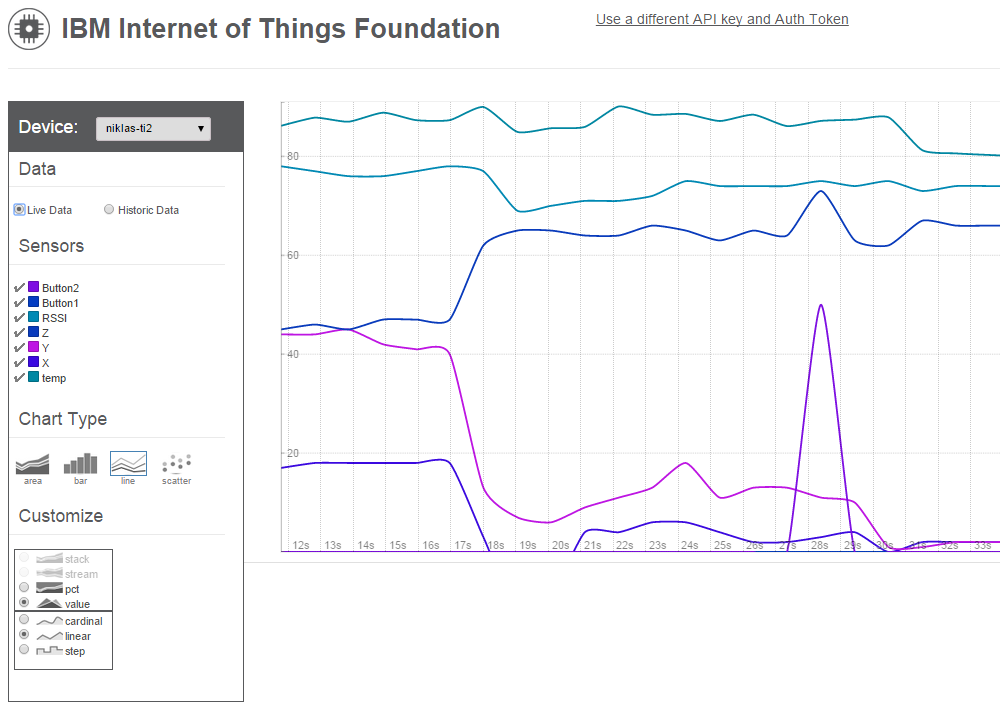
The screenshot below shows the data from a Texas Instruments Board.
There is also a promising experimental service IoT Real-Time Insights which might help with visualizing data (and more) but it seems to work for smartphone data only at this point.