The Watson Tradeoff Analytics service on Bluemix helps users to make decisions when balancing multiple conflicting goals. Below are a couple of samples which demonstrate the functionality of this service.
When buying technical devices I typically compare similar devices and then decide which one to buy. To find similar devices I often use filtering mechanisms that e-commerce sites provide. In some cases these sites also support comparing items by displaying tables. But static tables are not optimal to make decisions. For example often you cannot simply remove rows/criteria you’re not interested in, you cannot compare big amounts of items easily, you cannot apply filters and you don’t see easily the tradeoffs between the different criteria. The Tradeoff Analytics service addresses these challenges.
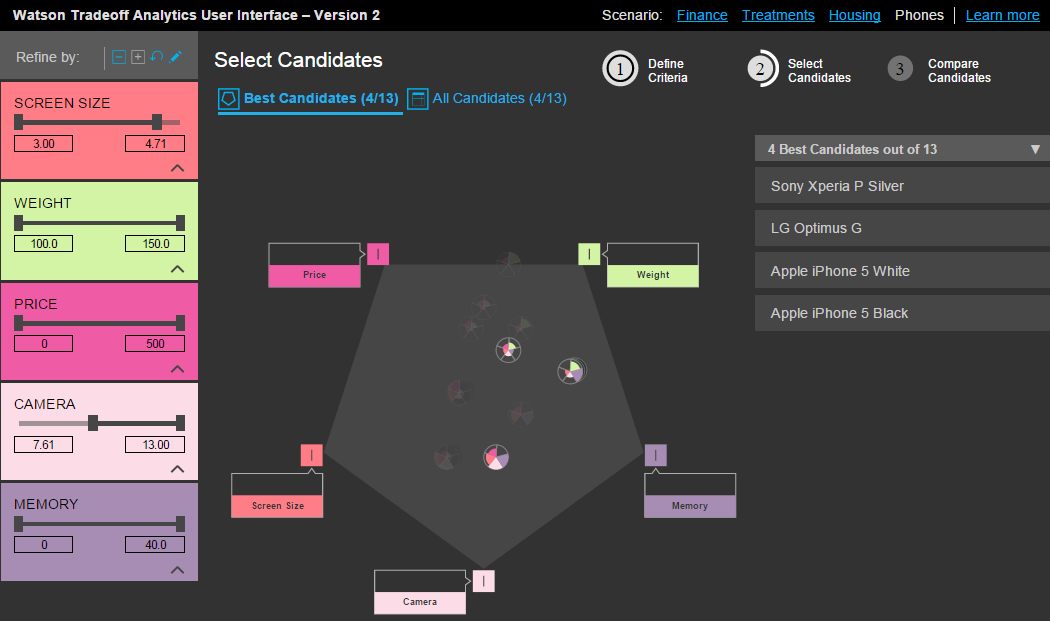
Here is a screenshot of the online demo to compare smartphones. You can enter the criteria you are interested in, phones can be filtered by values of certain criteria and the identified phones are displayed.
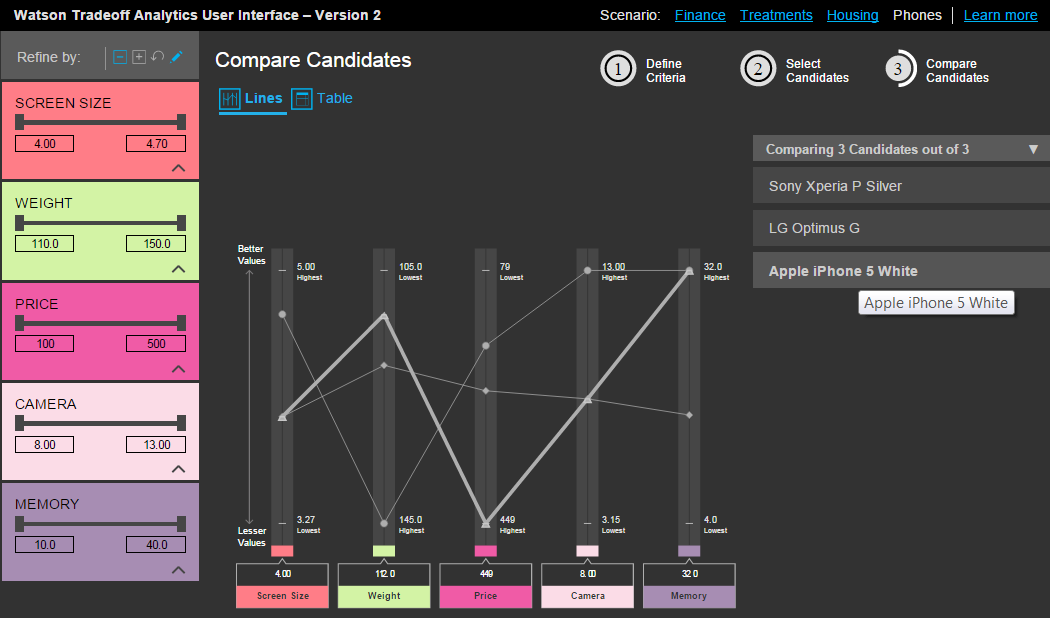
After you’ve selected the most promising phones you can compare them in a line chart or table.
The Tradeoff Analytics service is slightly different from most other Bluemix services. There is also a REST API but the main functionality happens in the user interface. That’s why the service provides a visualization widget that can be used in HTML/JavaScript based frontends. Recently a new version of this widget was released.
The documentation of the service is very detailed and as for all Watson services Node.js and Java samples are provided. For a quick introduction to the service check out the video “Watson Tradeoff Analytics Service“.
In addition to the online demo there are also several other samples available:


