
For cloud-native applications Kubernetes and Istio deliver a lot of important functionality out of the box, for example certain metrics which are independent from the actual service implementations can be collected automatically.
However, other metrics are application specific, for example how many times certain methods have been invoked and how long they take. Eclipse MicroProfile allows Java developers to easily expose these metrics. Check out the list of available Java annotations.
The application metrics can be displayed in Prometheus which comes with Istio. Other Istio metrics can be displayed in the Prometheus dashboard as well.
I’ve implemented a little sample that shows how to generate metrics from Java based microservices and how to access them in the Prometheus dashboard.
Get the code from GitHub.
MicroProfile
In the MicroProfile code Java annotations can be used. In this example the amount of times the ‘/getmultiple’ endpoints is invoked and the durations of this method is measured.
1
2
3
4
5
6
7
8
9
10
11
12
13
14
@Timed(name = "getArticlesTimed",
  absolute = true,
  displayName = "web-api /getmultiple timer",
  description = "Time taken by com.ibm.webapi.apis.GetArticles.getArticles")
@Counted(name = "getArticlesCounted",
  absolute = true,
  displayName = "web-api /getmultiple count",
  description = "Number of times com.ibm.webapi.apis.GetArticles.getArticles has been invoked",
  monotonic = true)
@Metered(name = "getArticlesMetered",
  displayName = "web-api /getmultiple frequency",
  description = "Rate the throughput of com.ibm.webapi.apis.GetArticles.getArticles")
@GET
@Path("/getmultiple")
In order to use these annotations in Java code, I’ve defined the dependencies in pom.xml. To keep it simple, I use the two ‘umbrella’ features javaee-api and microprofile.
1
2
3
4
5
6
7
8
9
10
11
12
13
14
15
<dependencies>
  <dependency>
    <groupId>javax</groupId>
    <artifactId>javaee-api</artifactId>
    <version>8.0</version>
    <scope>provided</scope>
  </dependency>
  <dependency>
    <groupId>org.eclipse.microprofile</groupId>
    <artifactId>microprofile</artifactId>
    <version>2.1</version>
    <scope>provided</scope>
    <type>pom</type>
  </dependency>
</dependencies>
In order to run the MicroProfile service on Kubernetes, you need a Docker image. Check out my previous article how to dockerize MicroProfile services.
Next in server.xml a couple of settings need to be done. You need to define the monitor feature and disable authentication. I have read in several articles that https is required, but for me http works as well. To keep it as simple as possible, I also disabled authentication. However, in a production application you’d use https and require authentication.
1
2
3
4
5
6
7
8
9
10
11
<?xml version="1.0" encoding="UTF-8"?>
<server description="OpenLiberty Server">
  <featureManager>
    <feature>webProfile-8.0</feature>
    <feature>microProfile-2.1</feature>
    <feature>usr:opentracingZipkin-0.31</feature>
    <feature>monitor-1.0</feature>
  </featureManager>
  <httpEndpoint id="defaultHttpEndpoint" host="*" httpPort="9080" httpsPort="9443"/>
  <mpMetrics authentication="false"/>
</server>
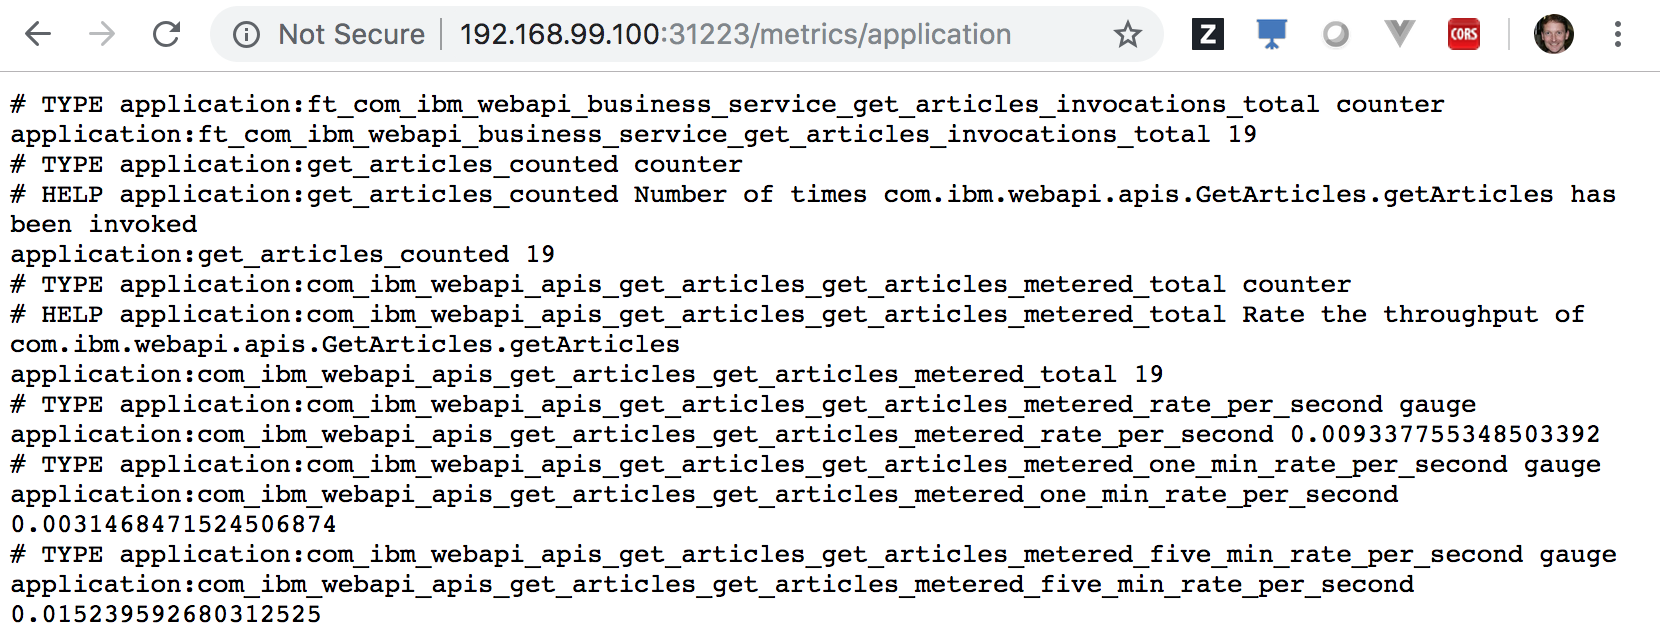
In order to see the metrics, you can trigger endpoints like http://192.168.99.100:31223/metrics/application. Note that you have to replace the IP address with the IP address of your cluster and the port with the port of your service.
Prometheus
In order to see the metrics in Prometheus in Istio, some additional configuration needs to be done.
First you need to use an annotation like “webapi: ‘true’” in your service definition. You can choose whatever name you like.
1
2
3
4
5
6
7
8
9
10
11
12
13
14
15
kind: Service
apiVersion: v1
metadata:
  annotations:
    webapi: "true"
  name: web-api
  labels:
    app: web-api
spec:
  selector:
    app: web-api
  ports:
    - port: 9080
      name: http
  type: NodePort
In order to point Prometheus to the metrics endpoint of your service, you need to change the ConfigMap of Prometheus. The following snippet shows the simplest possible configuration (http and anonymous). Note that the job_name ‘webapi’ needs to match with the annotation of your service above.
1
2
3
4
5
6
7
8
9
10
- job_name: 'webapi'
  scheme: 'http'
  tls_config:
    insecure_skip_verify: true
  kubernetes_sd_configs:
  - role: endpoints
  relabel_configs:
  - source_labels: [__meta_kubernetes_service_annotation_webapi]
    action: keep
    regex: true
There are different ways to update Prometheus with this configuration. Since my goal is to provide starter code for cloud native applications, I’ve written a little script to automate this process. The Prometheus configuration is read, then the additional configuration is merged into the original configuration and at last the new configuration is applied.
1
2
3
4
5
kubectl get configmap prometheus -n istio-system -oyaml > ${root_folder}/istio/prometheus-config-org.yaml
sed -e '/kind: ConfigMap/r ./prometheus-config.yaml' -e '/kind: ConfigMap/d' ${root_folder}/istio/prometheus-config-org.yaml > ${root_folder}/istio/prometheus-config-new.yaml
kubectl replace --force -f ${root_folder}/istio/prometheus-config-new.yaml
pod=$(kubectl get pods -n istio-system | grep prometheus | awk ' {print $1} ')
kubectl delete pod $pod -n istio-system
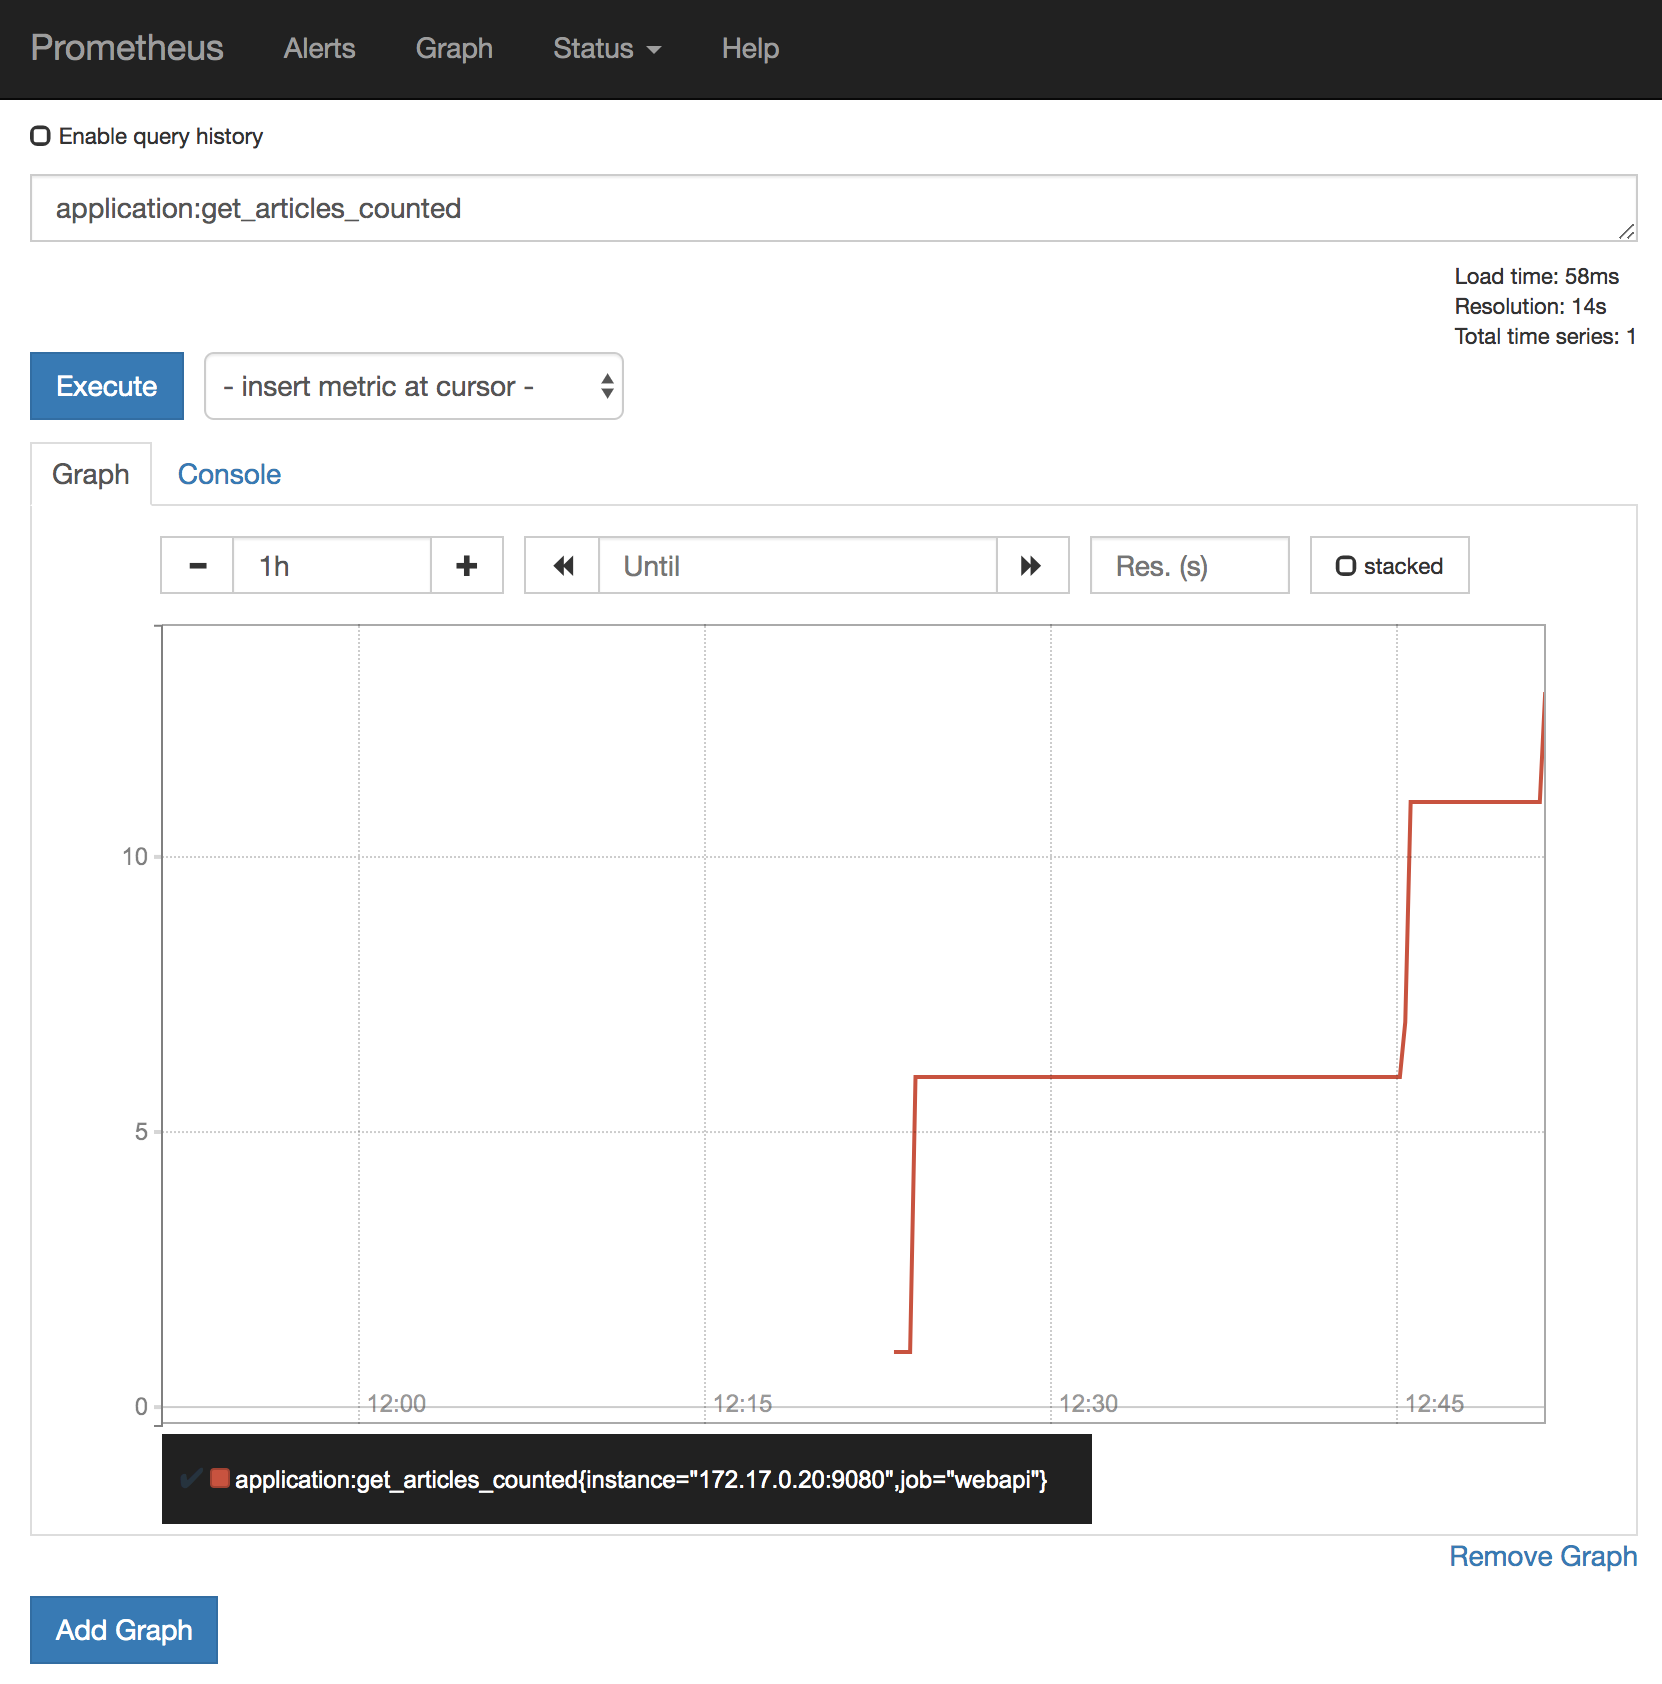
This image shows the Prometheus dashboard displaying the amount of times ‘/getmultiple’ has been invoked.
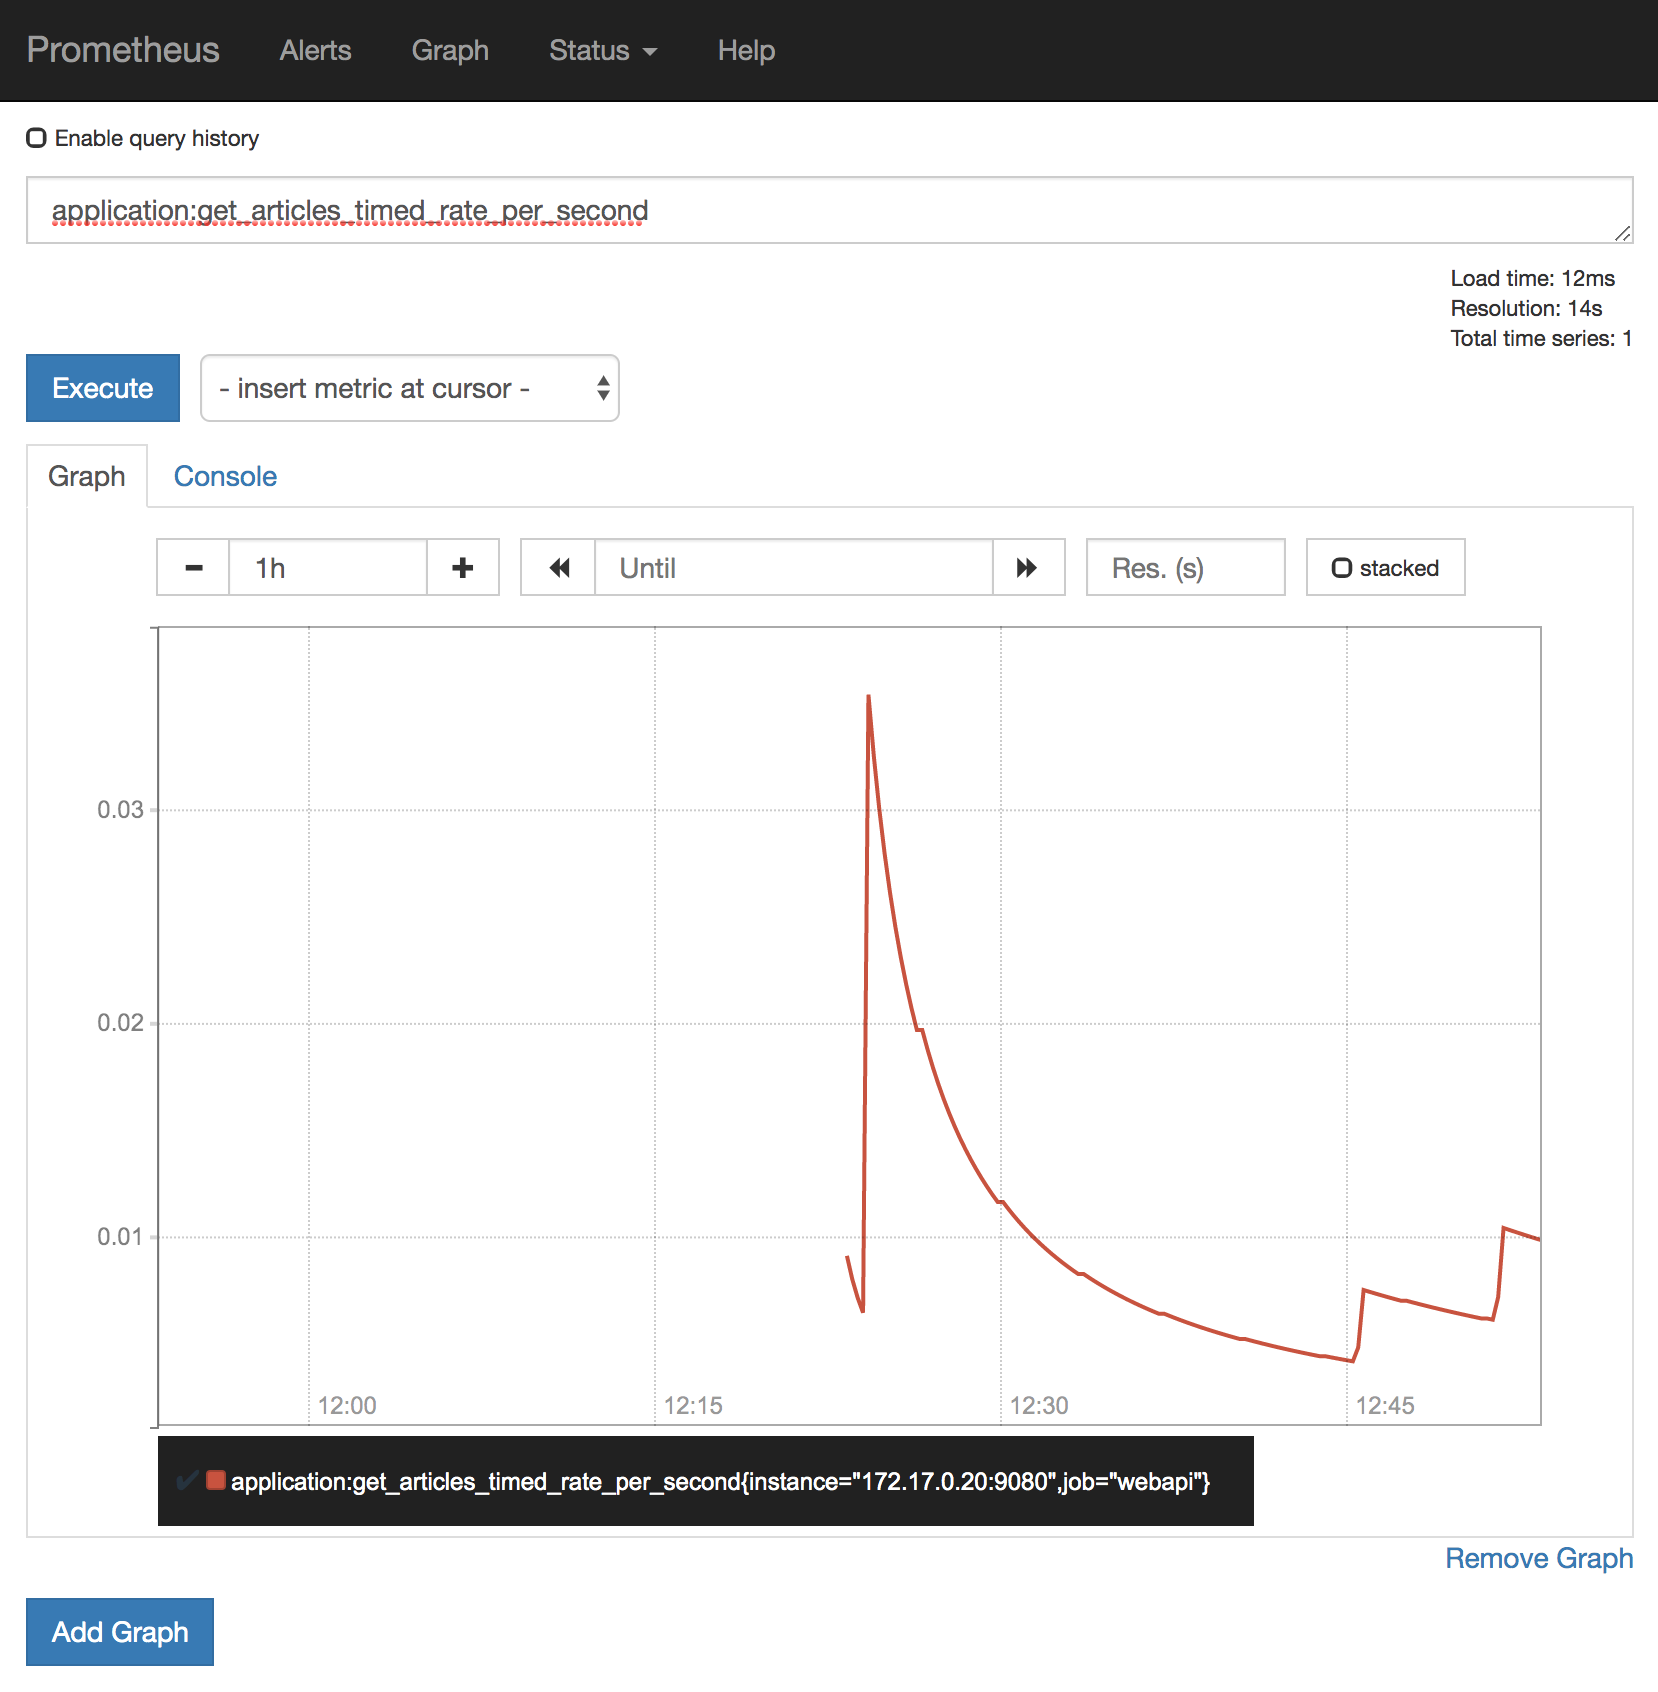
This image shows the rate per second:
If you want to try this yourself, follow the instructions in the readme of cloud-native-starter.