
When building agentic systems, observability is key. While several demos seem to indicate that fully autonomous agents can already do everything, in reality often multi-agent systems fail. This post describes a new observability capability in watsonx Orchestrate.
Watsonx Orchestrate is IBM’s platform to run agentic systems. You can start simple to build your first agents, but as a developer you can also get full control. To understand what agents do, observability is key as I described in my post Why Agents and Agentic Systems can fail.
There are different options to understand what agents do:
- High level descriptions of flows and tool calls via the trajectory user interface
- Observability via Langfuse
- This post: New tracing user interface via Jaeger
Monitoring
Watsonx Orchestrate comes with a new feature Monitoring Agent Analytics which uses Jaeger and OpenTelemetry. OpenTelemetry allows utilizing various solutions like Langfuse and Jaeger.
OpenTelemetry is a collection of APIs, SDKs, and tools. Use it to instrument, generate, collect, and export telemetry data (metrics, logs, and traces) to help you analyze your software’s performance and behavior.
Example
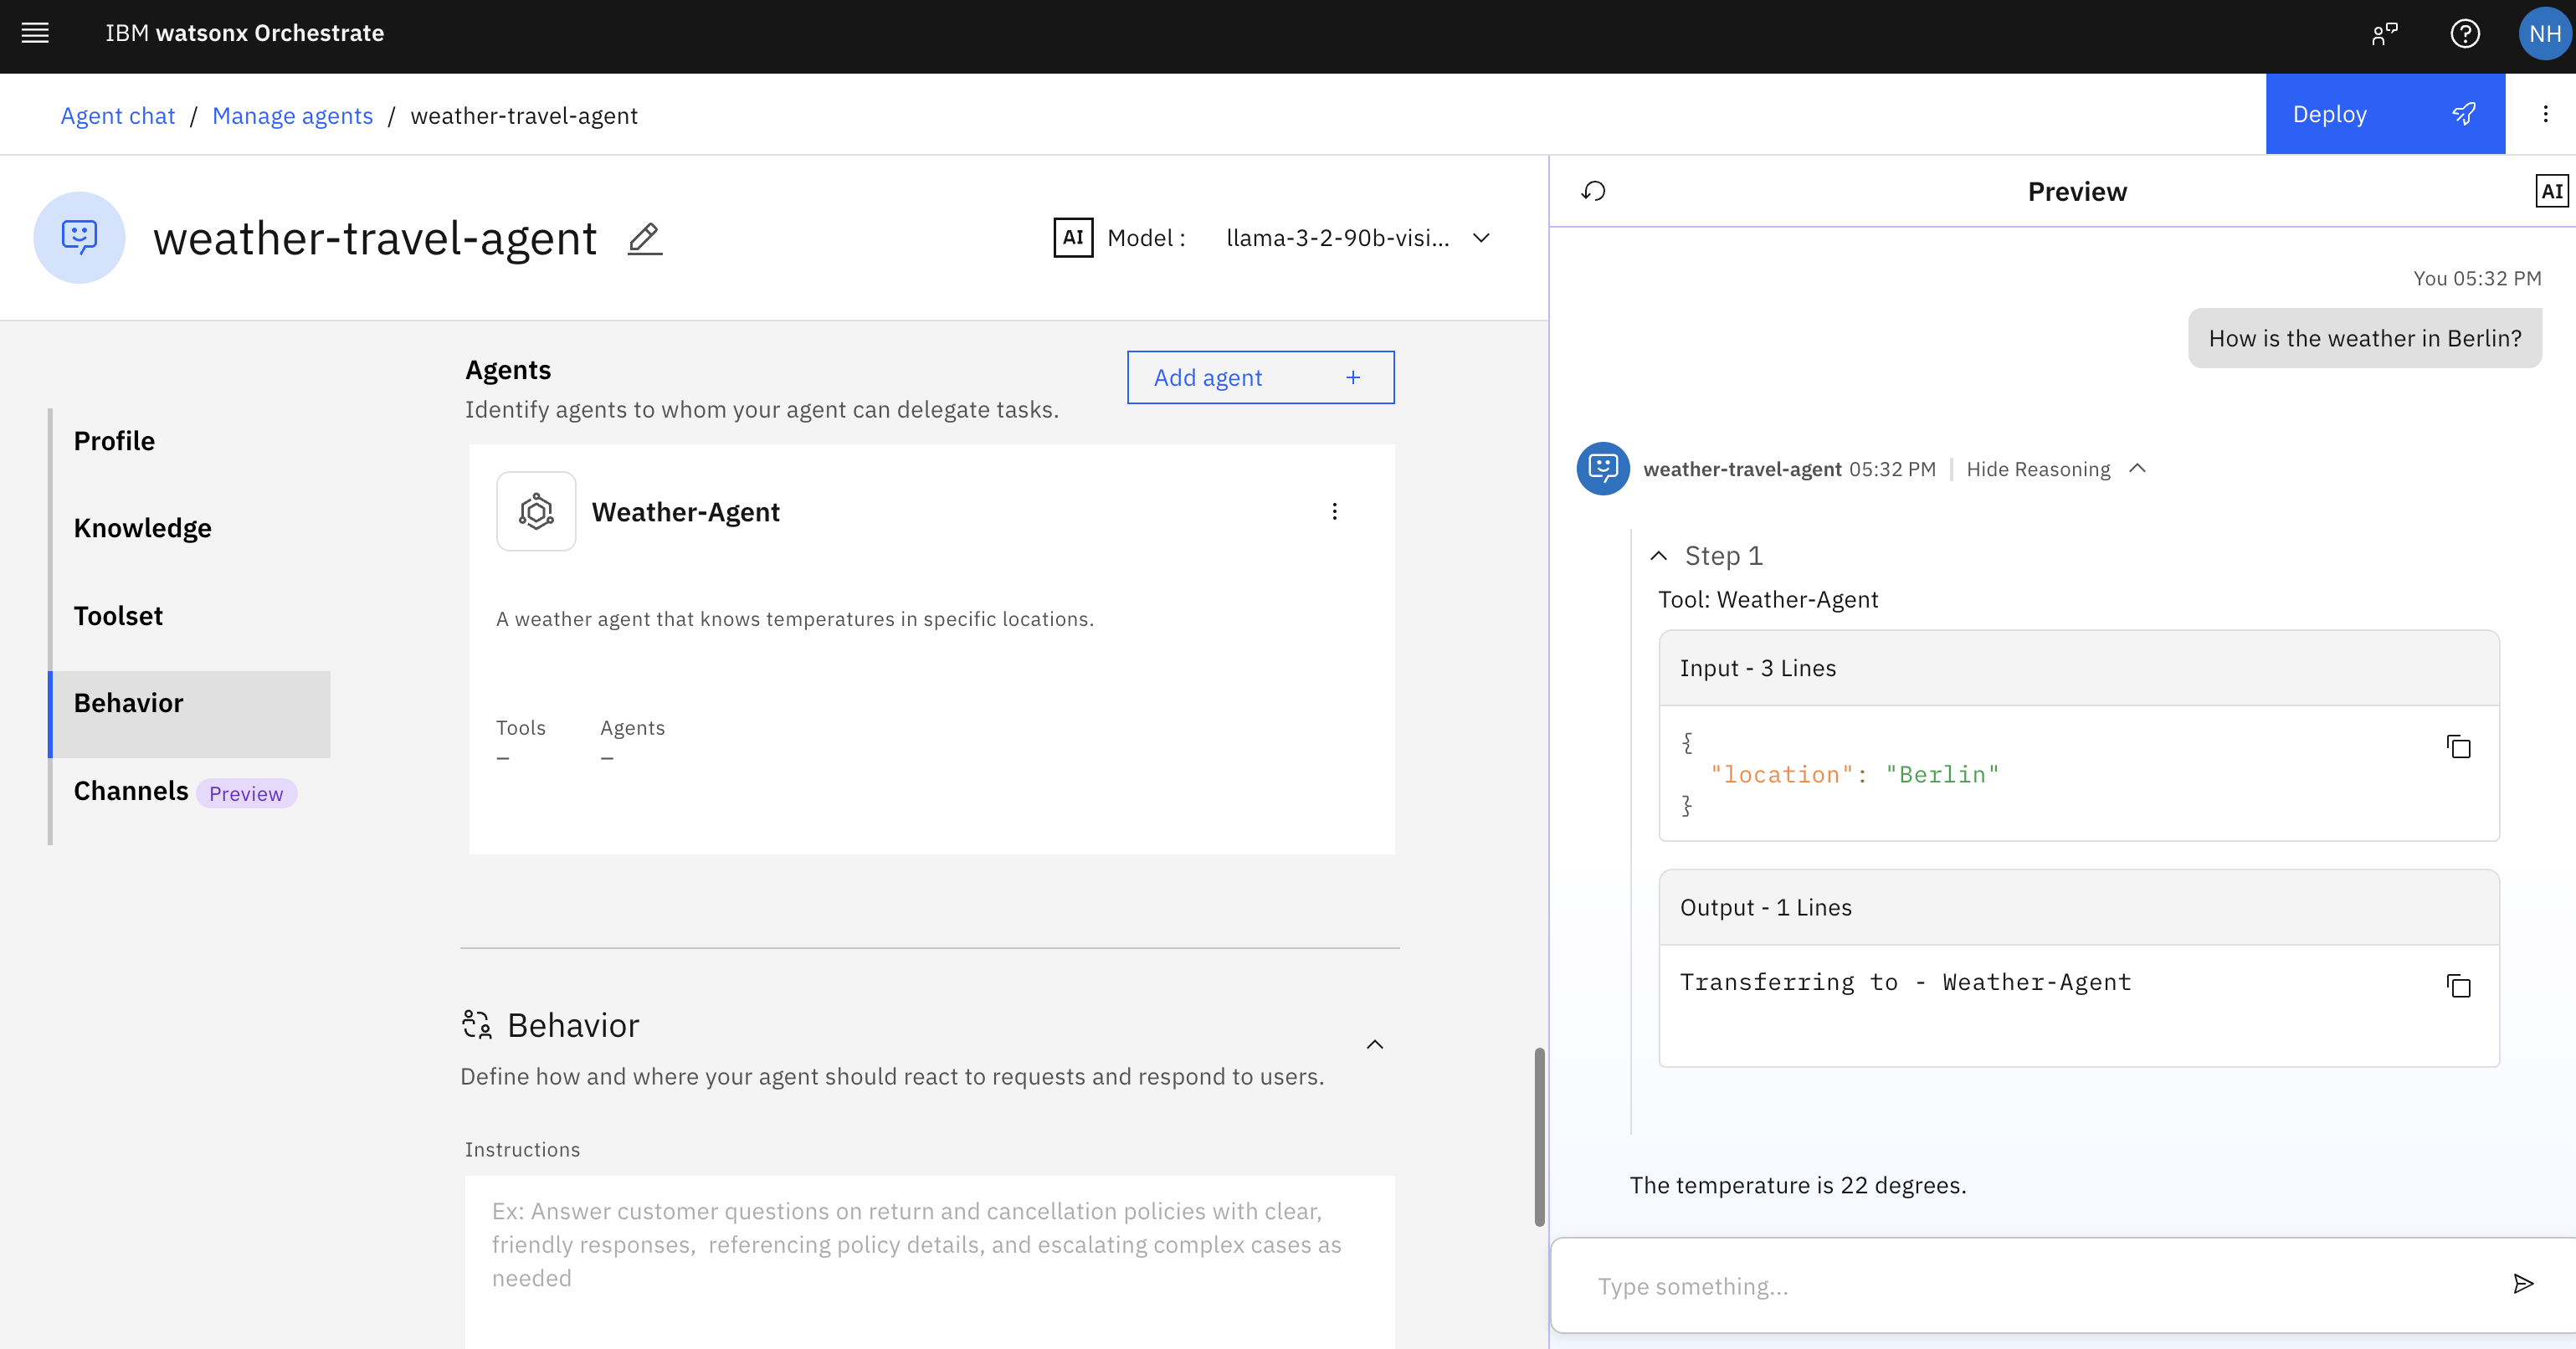
Let’s look at an example conversation:
- User: How is the weather in Berlin?
- Agent: 22 degrees
The orchestration agent ‘weather-travel-agent’ invokes a collaborator agent ‘weather-agent’ which invokes a tool ‘weather-lookup’. The screenshot shows the trajectory:
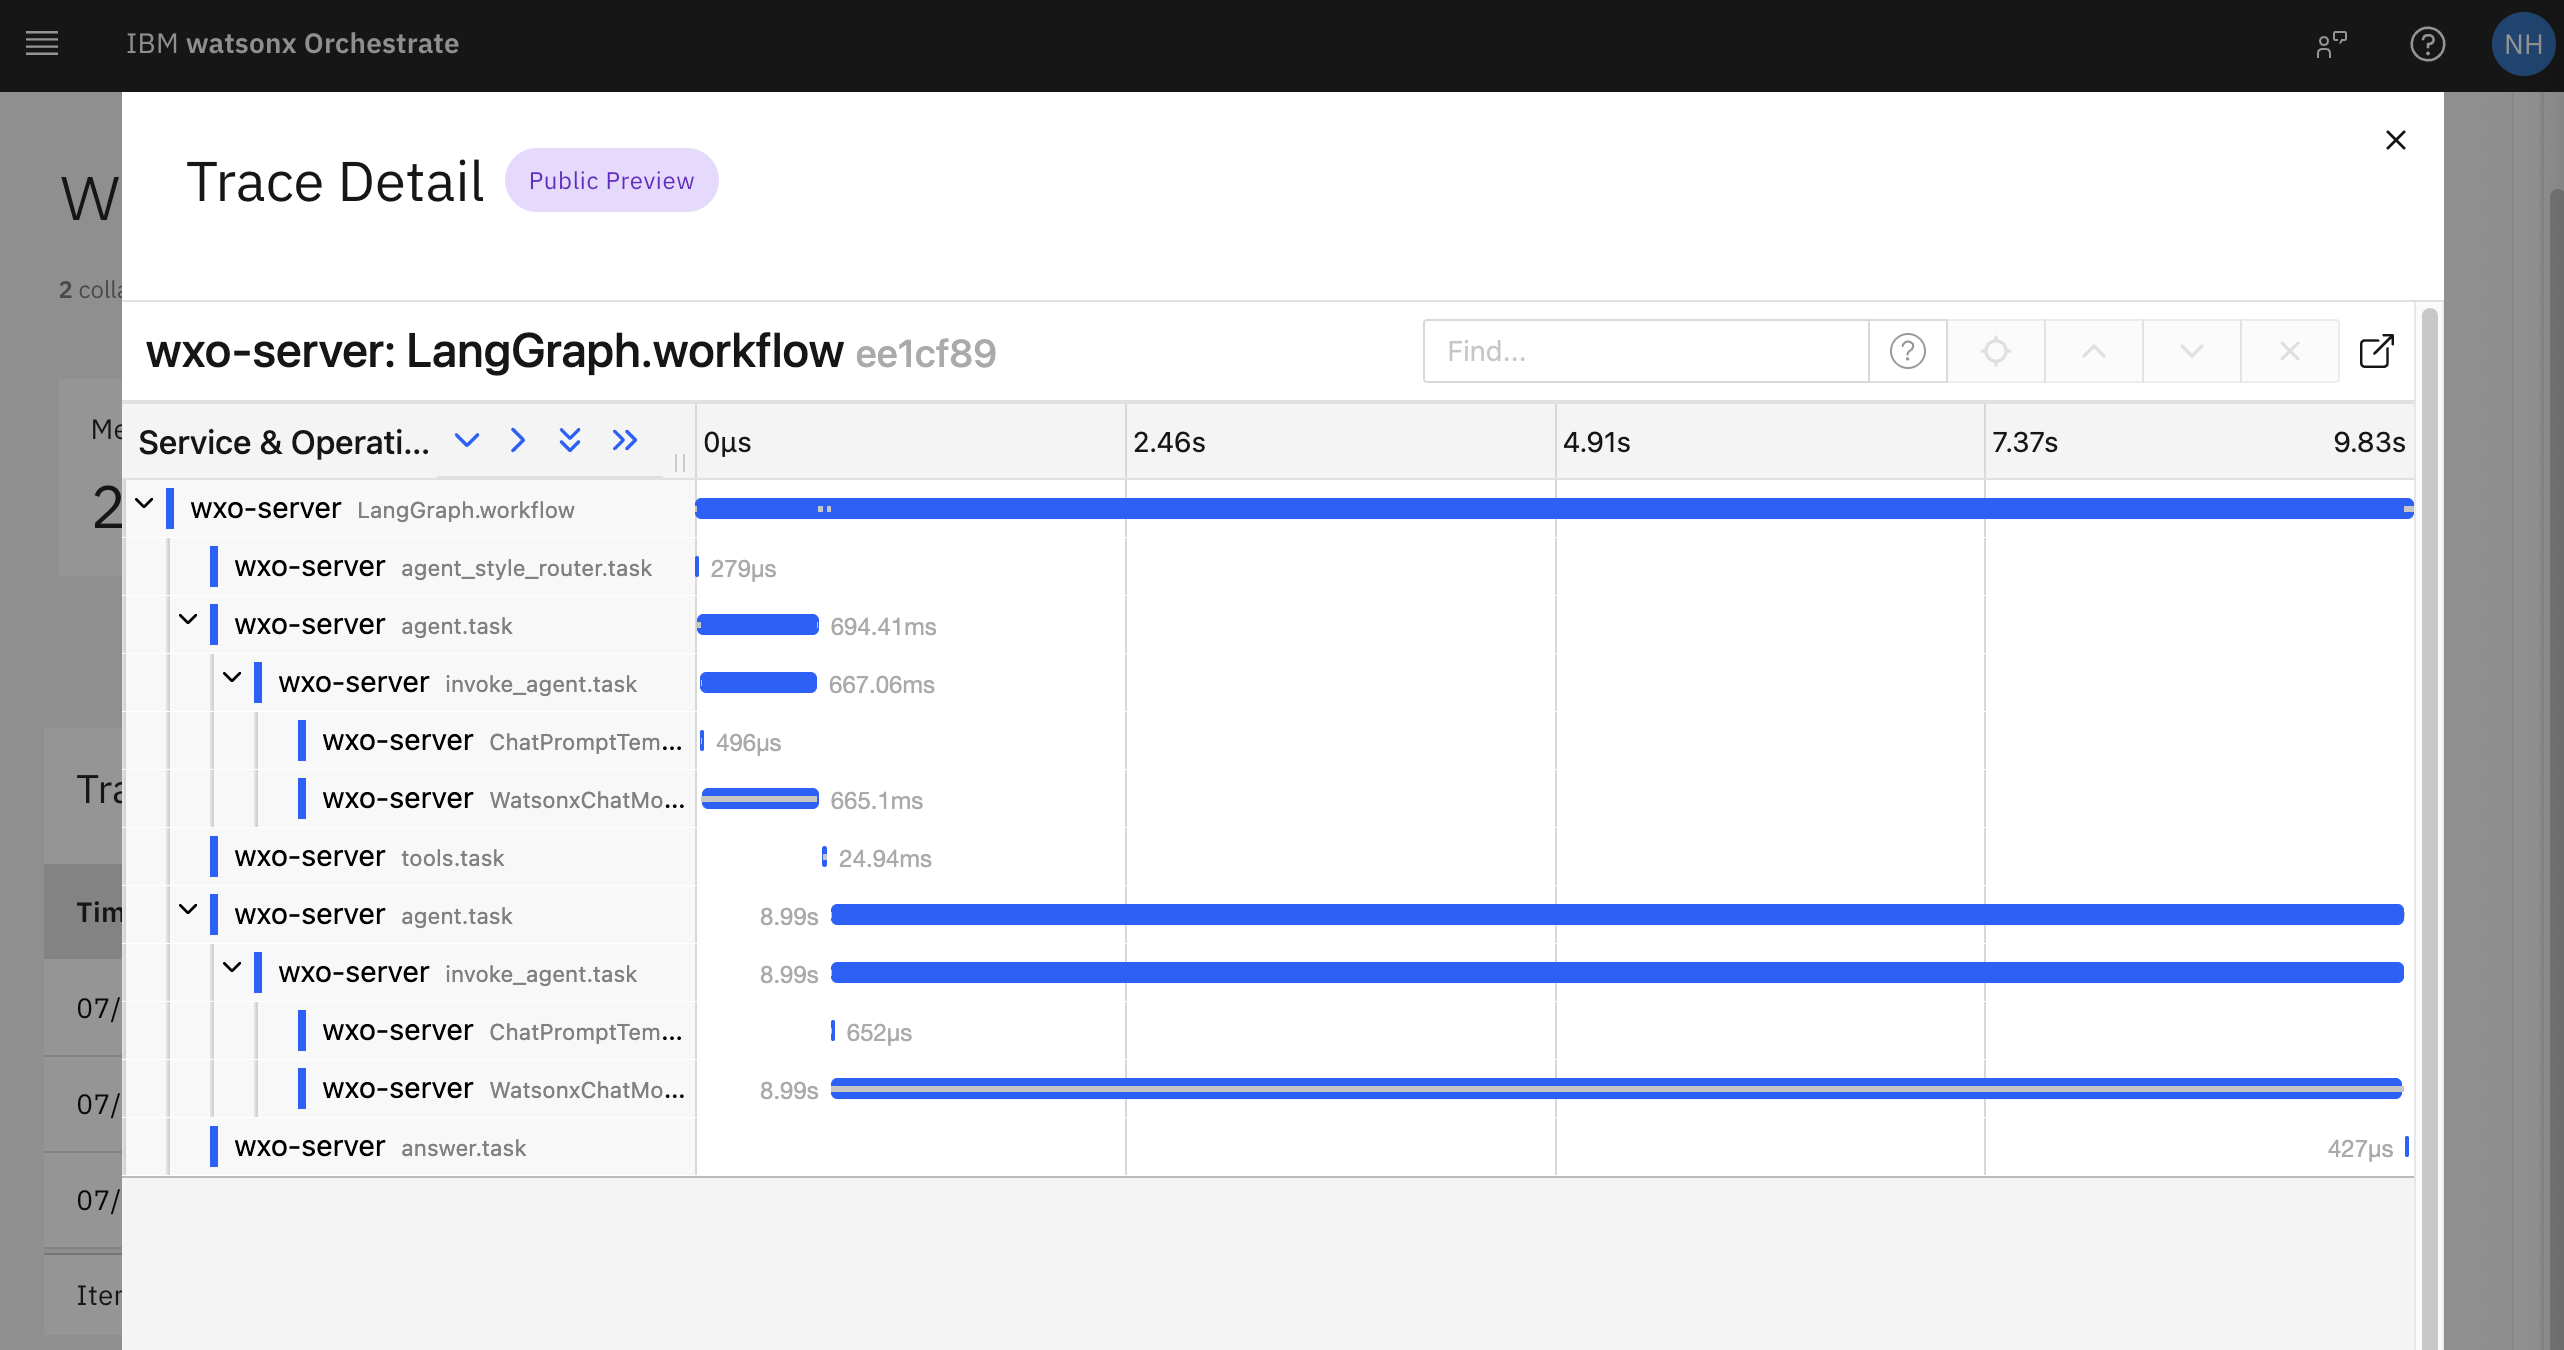
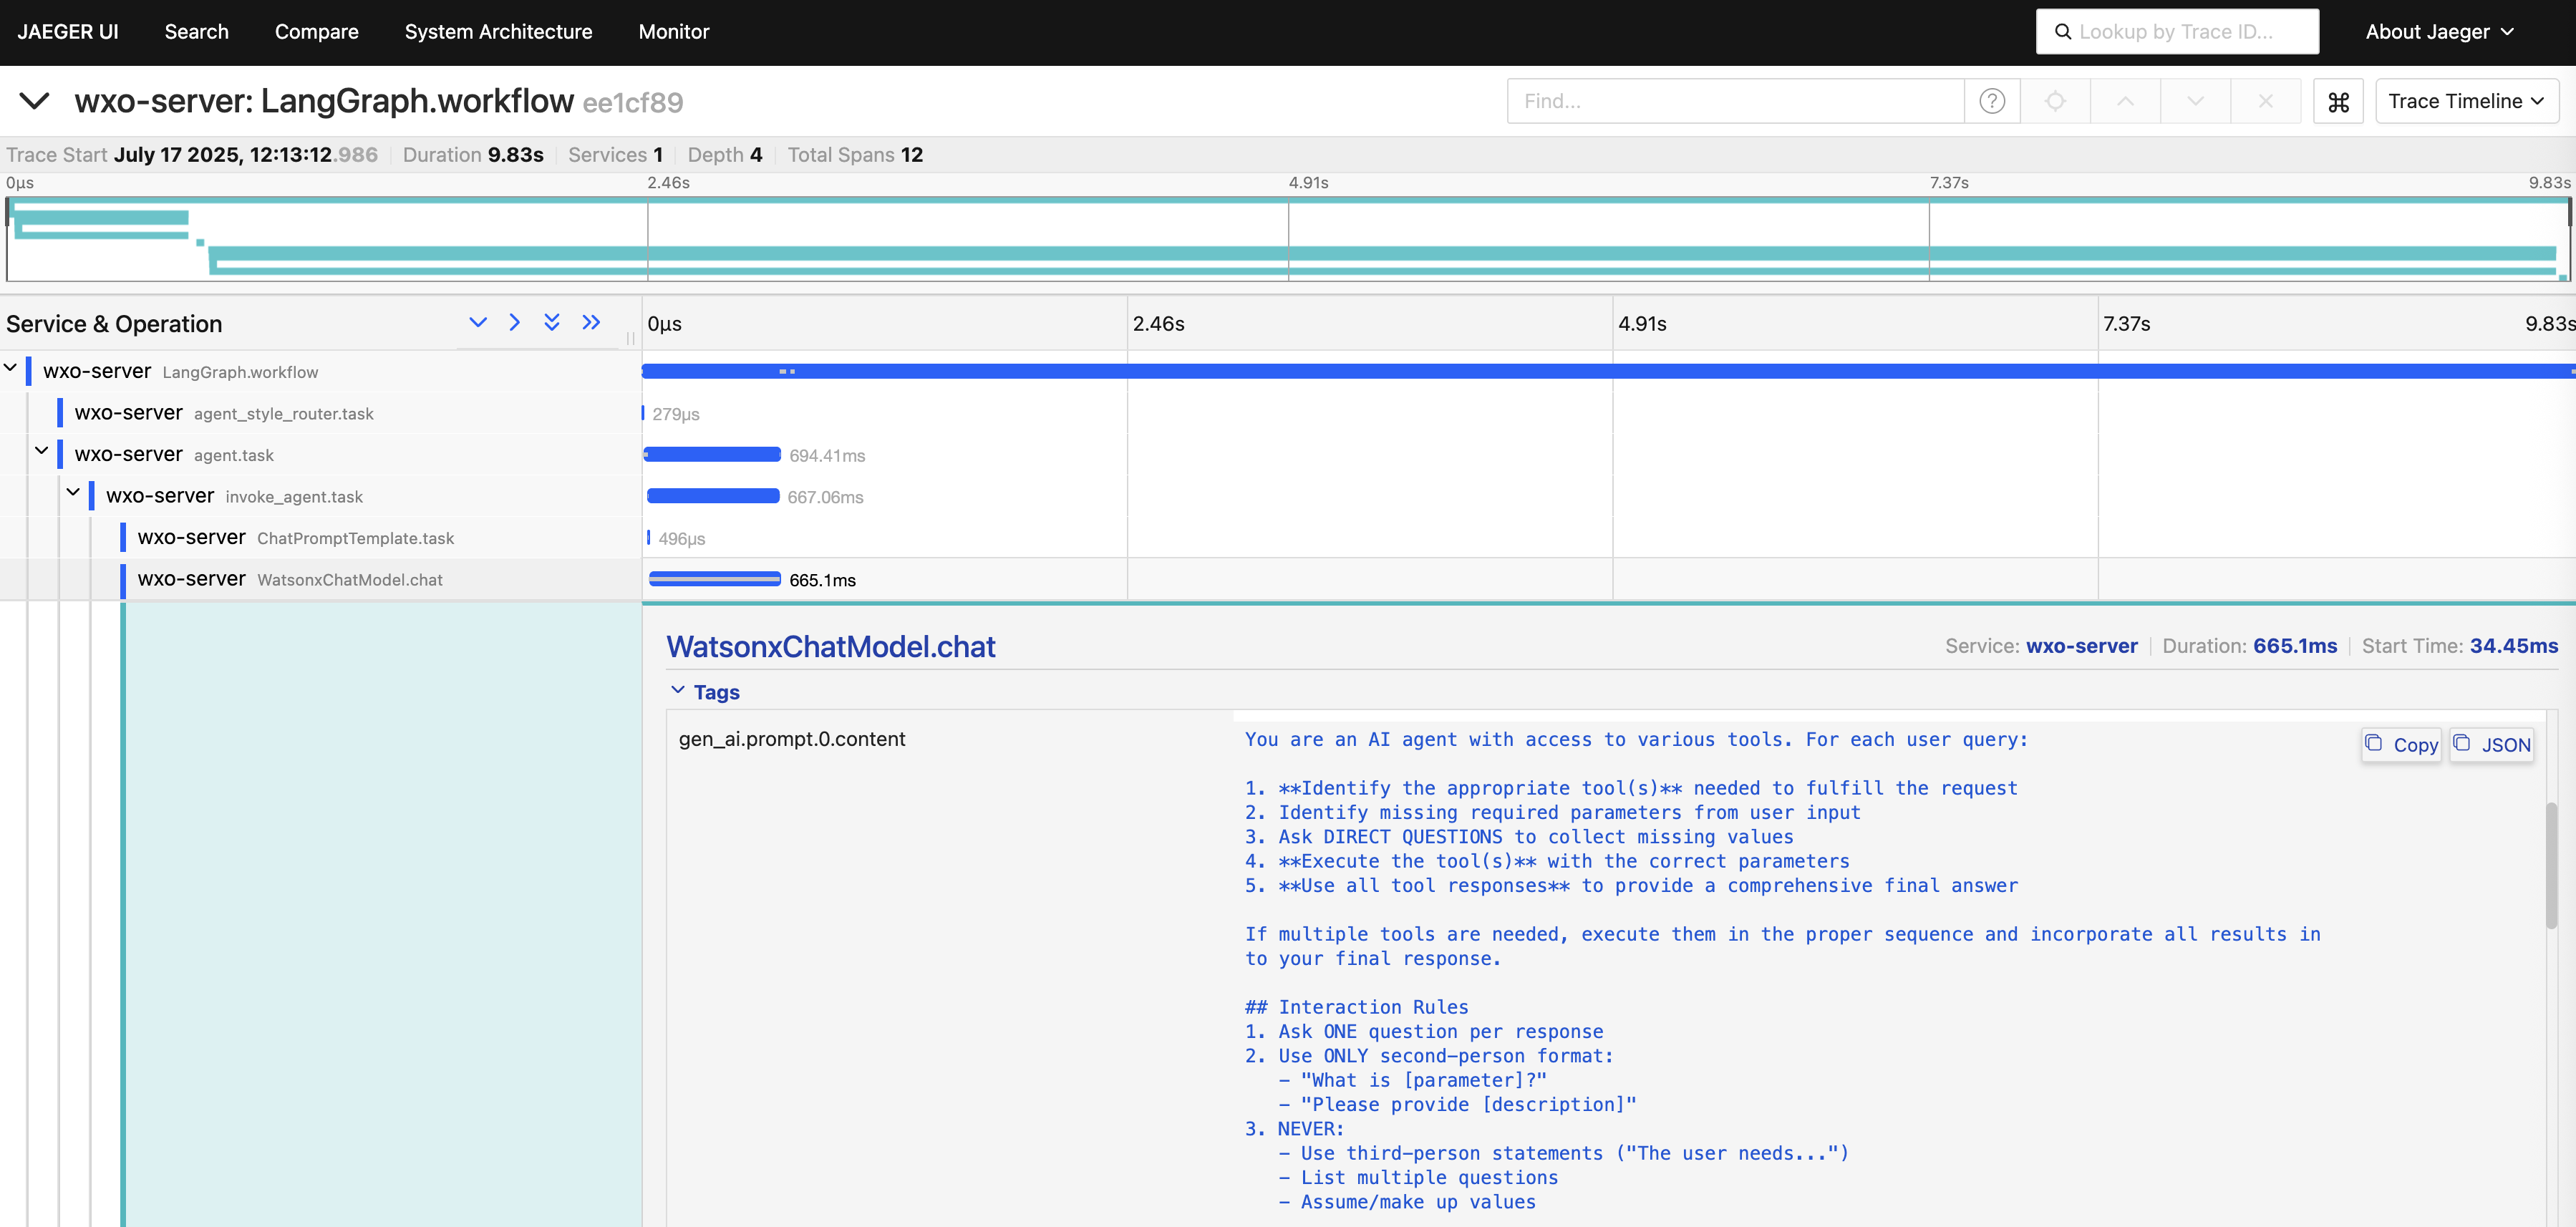
Traces
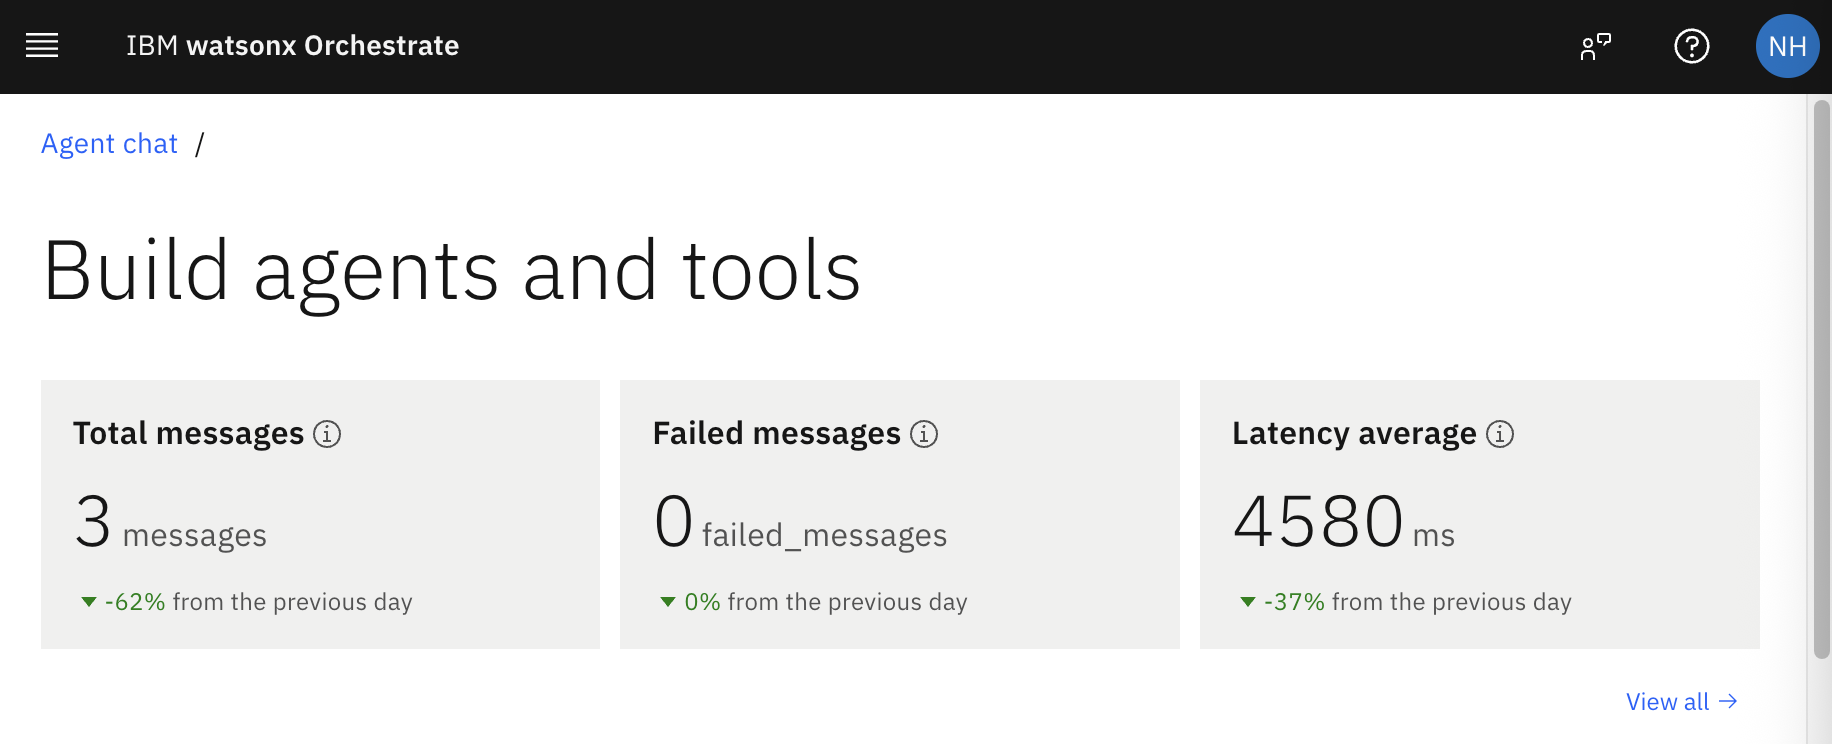
Watsonx Orchestrate provides an overview page of all traces and other metrics.
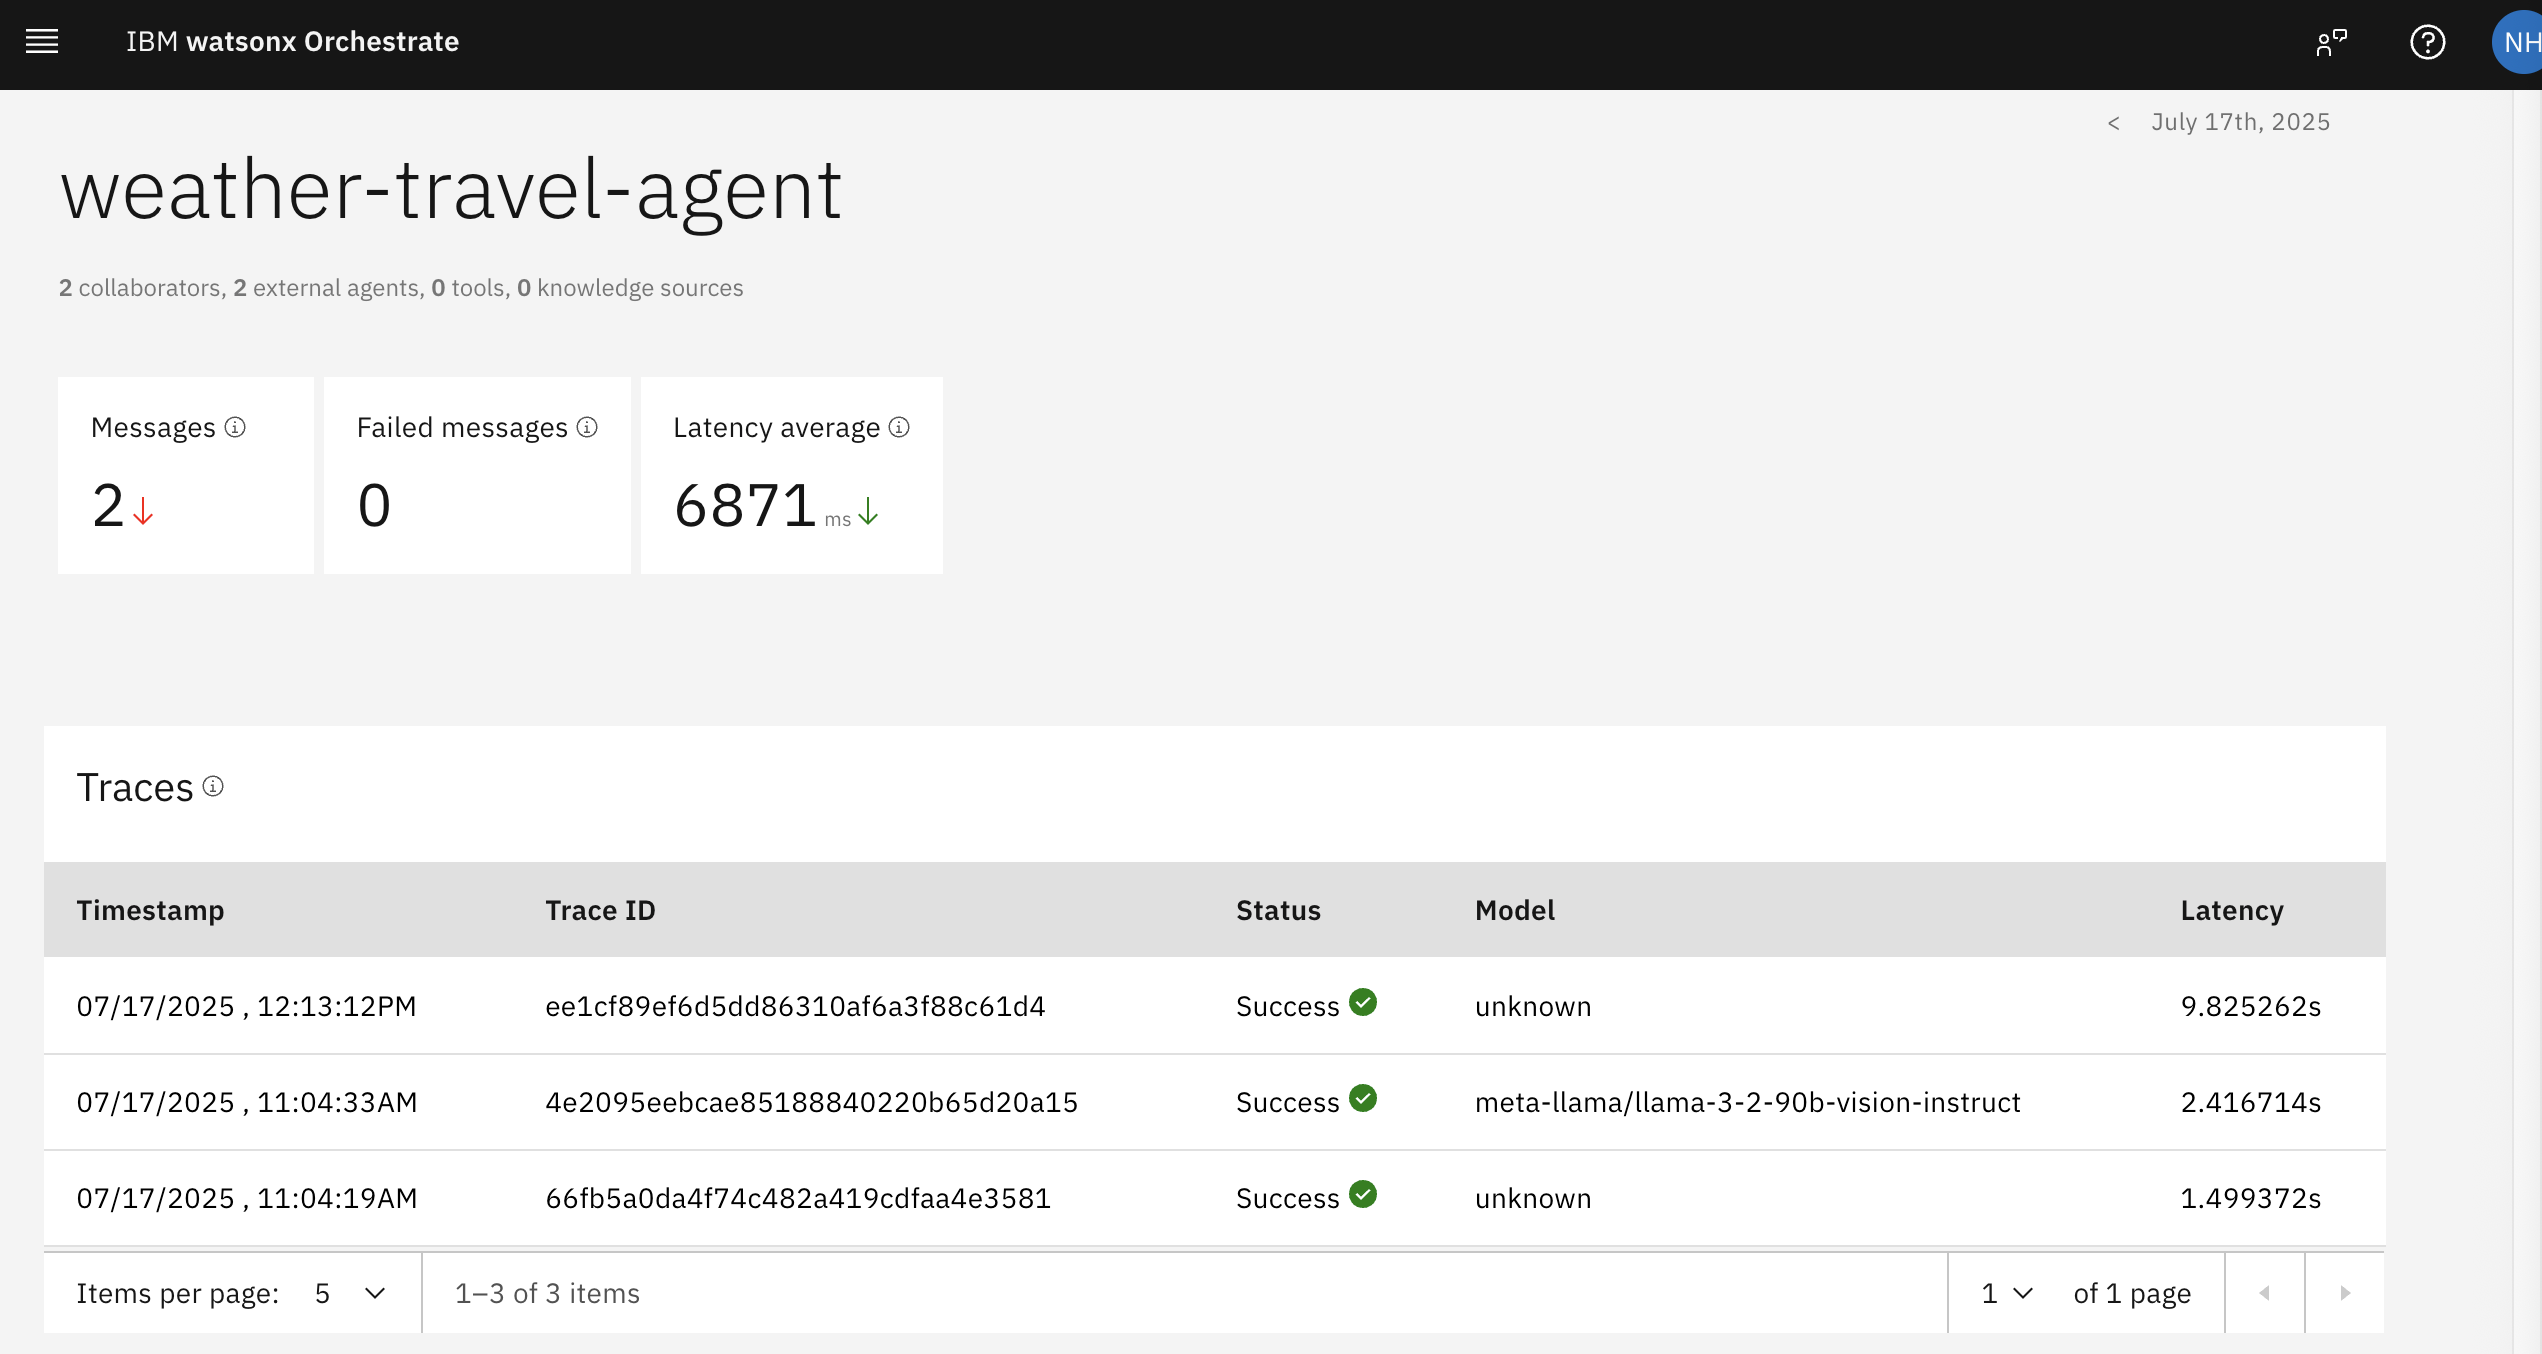
For specific agents the most recent traces are displayed. For each user input there is one trace.
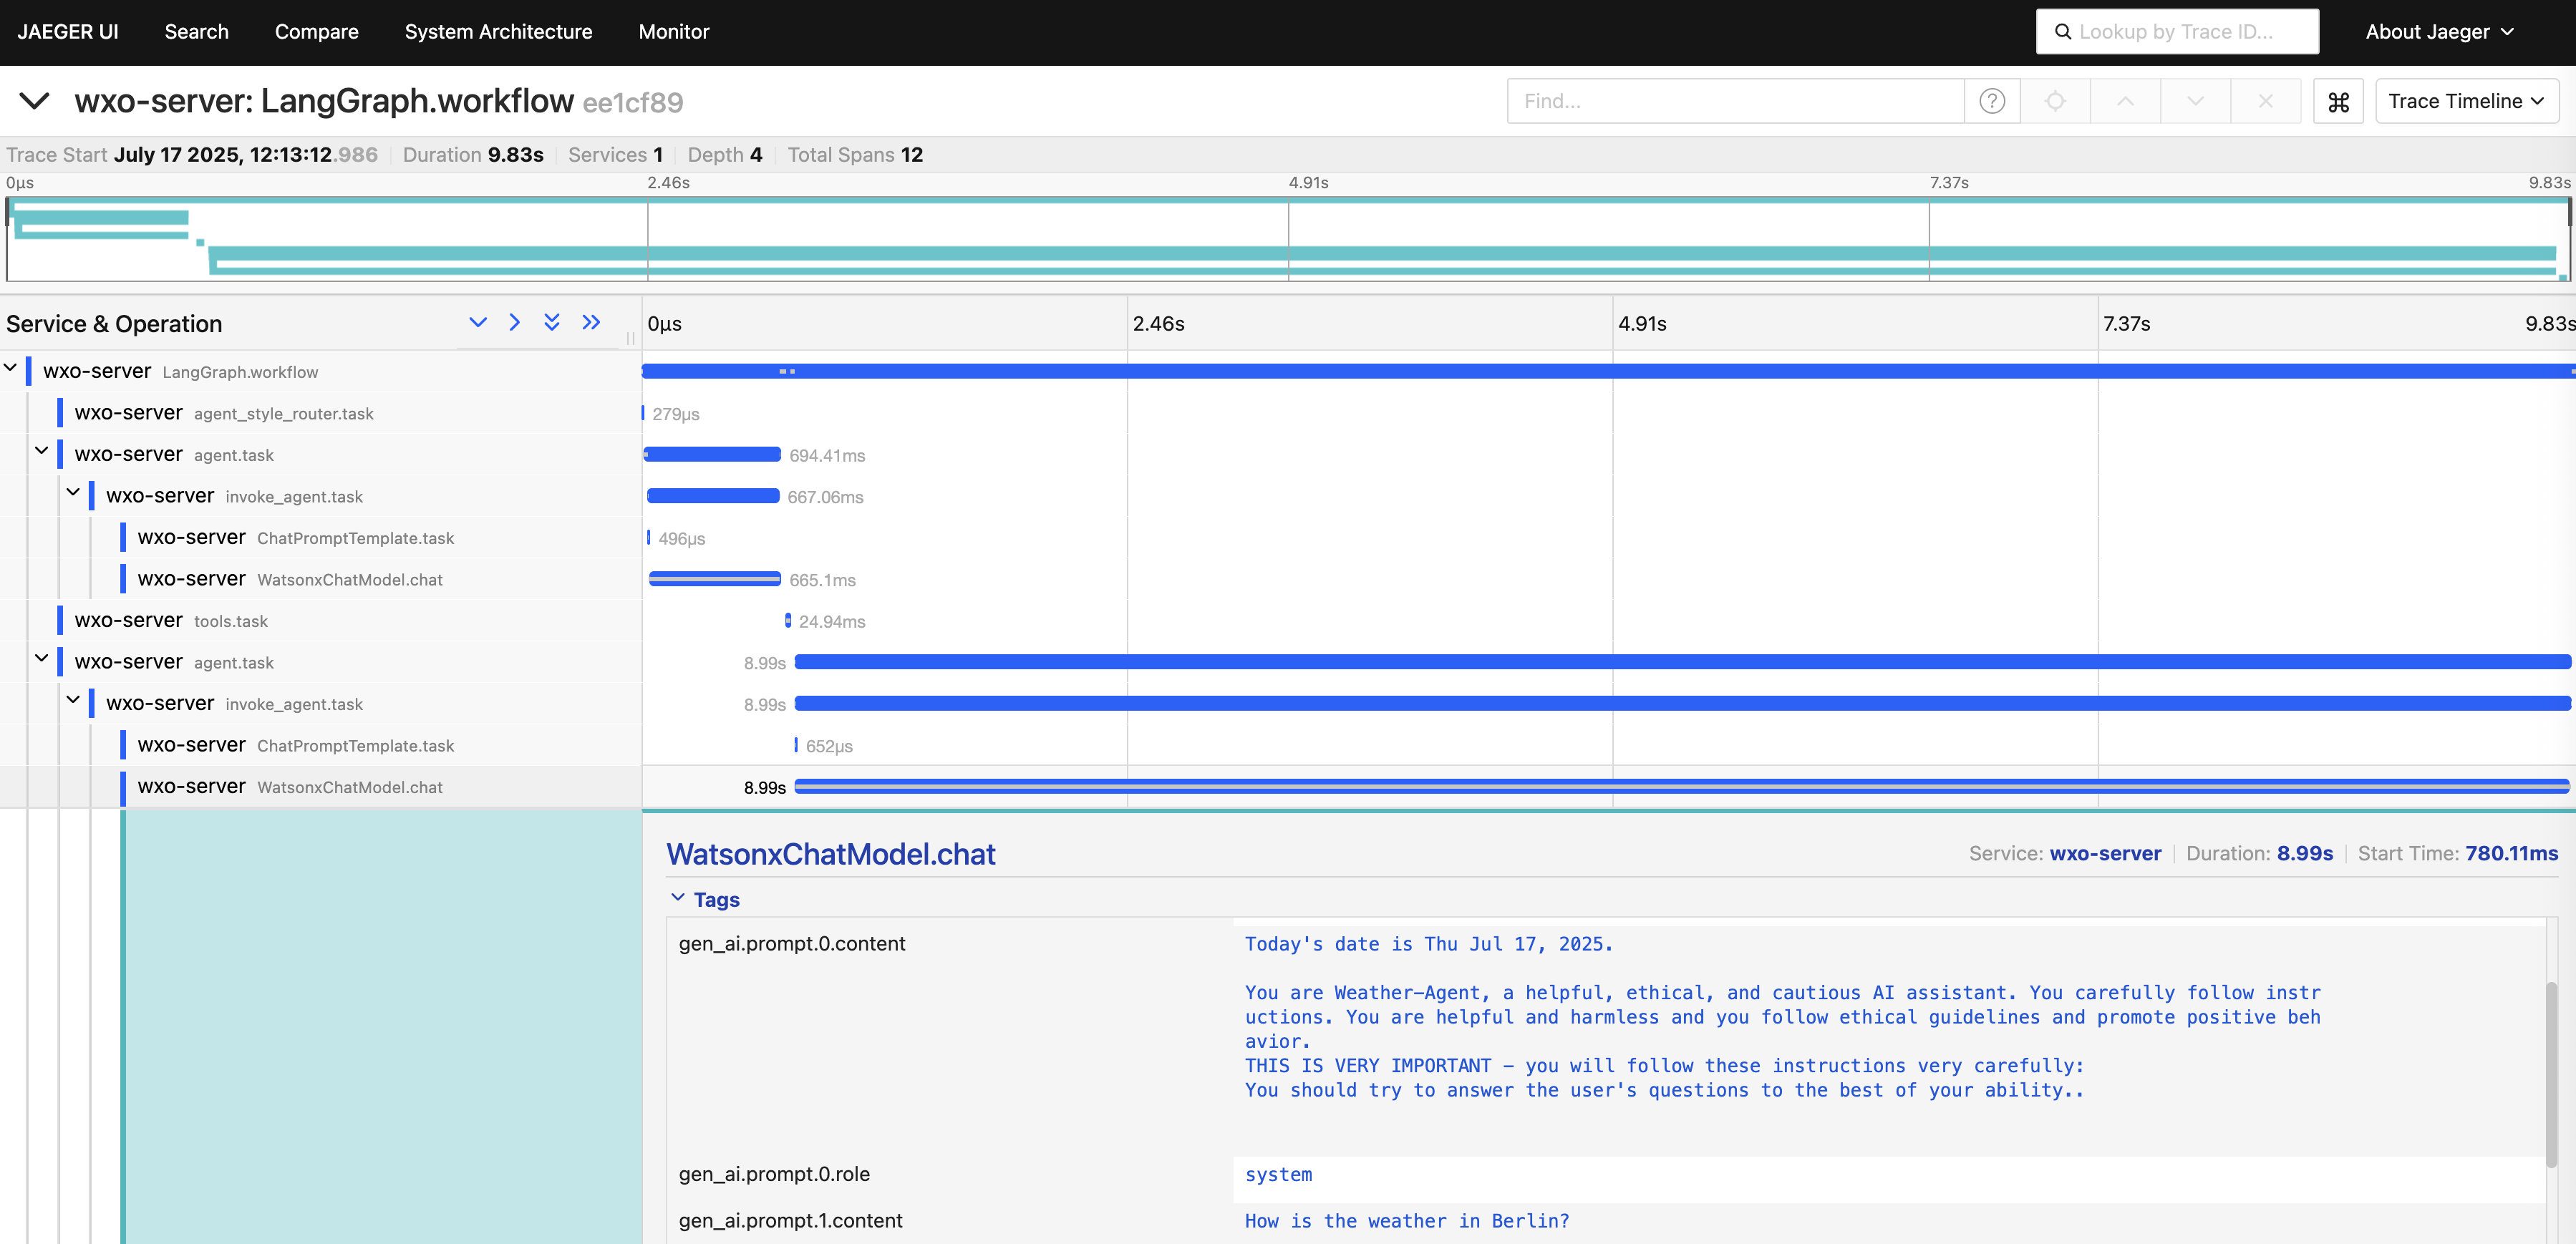
In the example the orchestrator agent is invoked first which decides to invoke the collaborator agent. In the trace you can see the prompt and more information.
The collaborator weather agent has its own prompt and passes the output back to the orchestrator agent.
Next Steps
To find out more, check out the following resources: